Lenovo 2012 Annual Report Download - page 132
Download and view the complete annual report
Please find page 132 of the 2012 Lenovo annual report below. You can navigate through the pages in the report by either clicking on the pages listed below, or by using the keyword search tool below to find specific information within the annual report.-
 1
1 -
2
-
3
-
4
-
5
-
6
-
7
-
8
-
9
-
10
-
11
-
12
-
13
-
14
-
15
-
16
-
17
-
18
-
19
-
20
-
21
-
22
-
23
-
24
-
25
-
26
-
27
-
28
-
29
-
30
-
31
-
32
-
33
-
34
-
35
-
36
-
37
-
38
-
39
-
40
-
41
-
42
-
43
-
44
-
45
-
46
-
47
-
48
-
49
-
50
-
51
-
52
-
53
-
54
-
55
-
56
-
57
-
58
-
59
-
60
-
61
-
62
-
63
-
64
-
65
-
66
-
67
-
68
-
69
-
70
-
71
-
72
-
73
-
74
-
75
-
76
-
77
-
78
-
79
-
80
-
81
-
82
-
83
-
84
-
85
-
86
-
87
-
88
-
89
-
90
-
91
-
92
-
93
-
94
-
95
-
96
-
97
-
98
-
99
-
100
-
101
-
102
-
103
-
104
-
105
-
106
-
107
-
108
-
109
-
110
-
111
-
112
-
113
-
114
-
115
-
116
-
117
-
118
-
119
-
120
-
121
-
 122
122 -
 123
123 -
 124
124 -
 125
125 -
 126
126 -
 127
127 -
 128
128 -
 129
129 -
 130
130 -
 131
131 -
 132
132 -
 133
133 -
 134
134 -
 135
135 -
 136
136 -
 137
137 -
 138
138 -
 139
139 -
 140
140 -
 141
141 -
 142
142 -
143
-
144
-
145
-
146
-
147
-
148
-
149
-
150
-
151
-
152
-
153
-
154
-
155
-
156
-
157
-
158
-
159
-
160
-
161
-
162
-
163
-
164
-
165
-
166
-
167
-
168
-
169
-
170
-
171
-
172
-
173
-
174
-
175
-
176
-
177
-
178
-
179
-
180
 |
 |
2011/12 Annual Report Lenovo Group Limited
130
NOTES TO THE FINANCIAL STATEMENTS
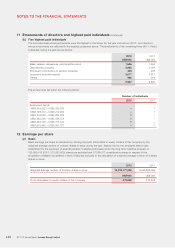
3 Financial risk management (continued)
(d) Fair value estimation (continued)
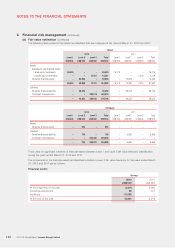
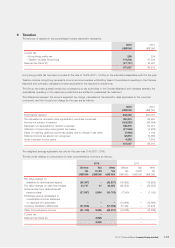
The following table presents the assets and liabilities that are measured at fair value at March 31, 2012 and 2011.
Group
2012 2011
Level 1 Level 2 Level 3 Total Level 1 Level 2 Level 3 Total
US$’000 US$’000 US$’000 US$’000 US$’000 US$’000 US$’000 US$’000
Assets
Available-for-sale financial assets
Listed equity investments 59,625 – – 59,625 76,473 – – 76,473
Unlisted equity investments – – 12,321 12,321 – – 2,216 2,216
Derivative financial assets –62,883 –62,883 –13,295 –13,295
59,625 62,883 12,321 134,829 76,473 13,295 2,216 91,984
Liabilities
Derivative financial liabilities –49,253 –49,253 –39,223 –39,223
Contingent considerations – – 428,915 428,915 – – – –
–49,253 428,915 478,168 –39,223 –39,223
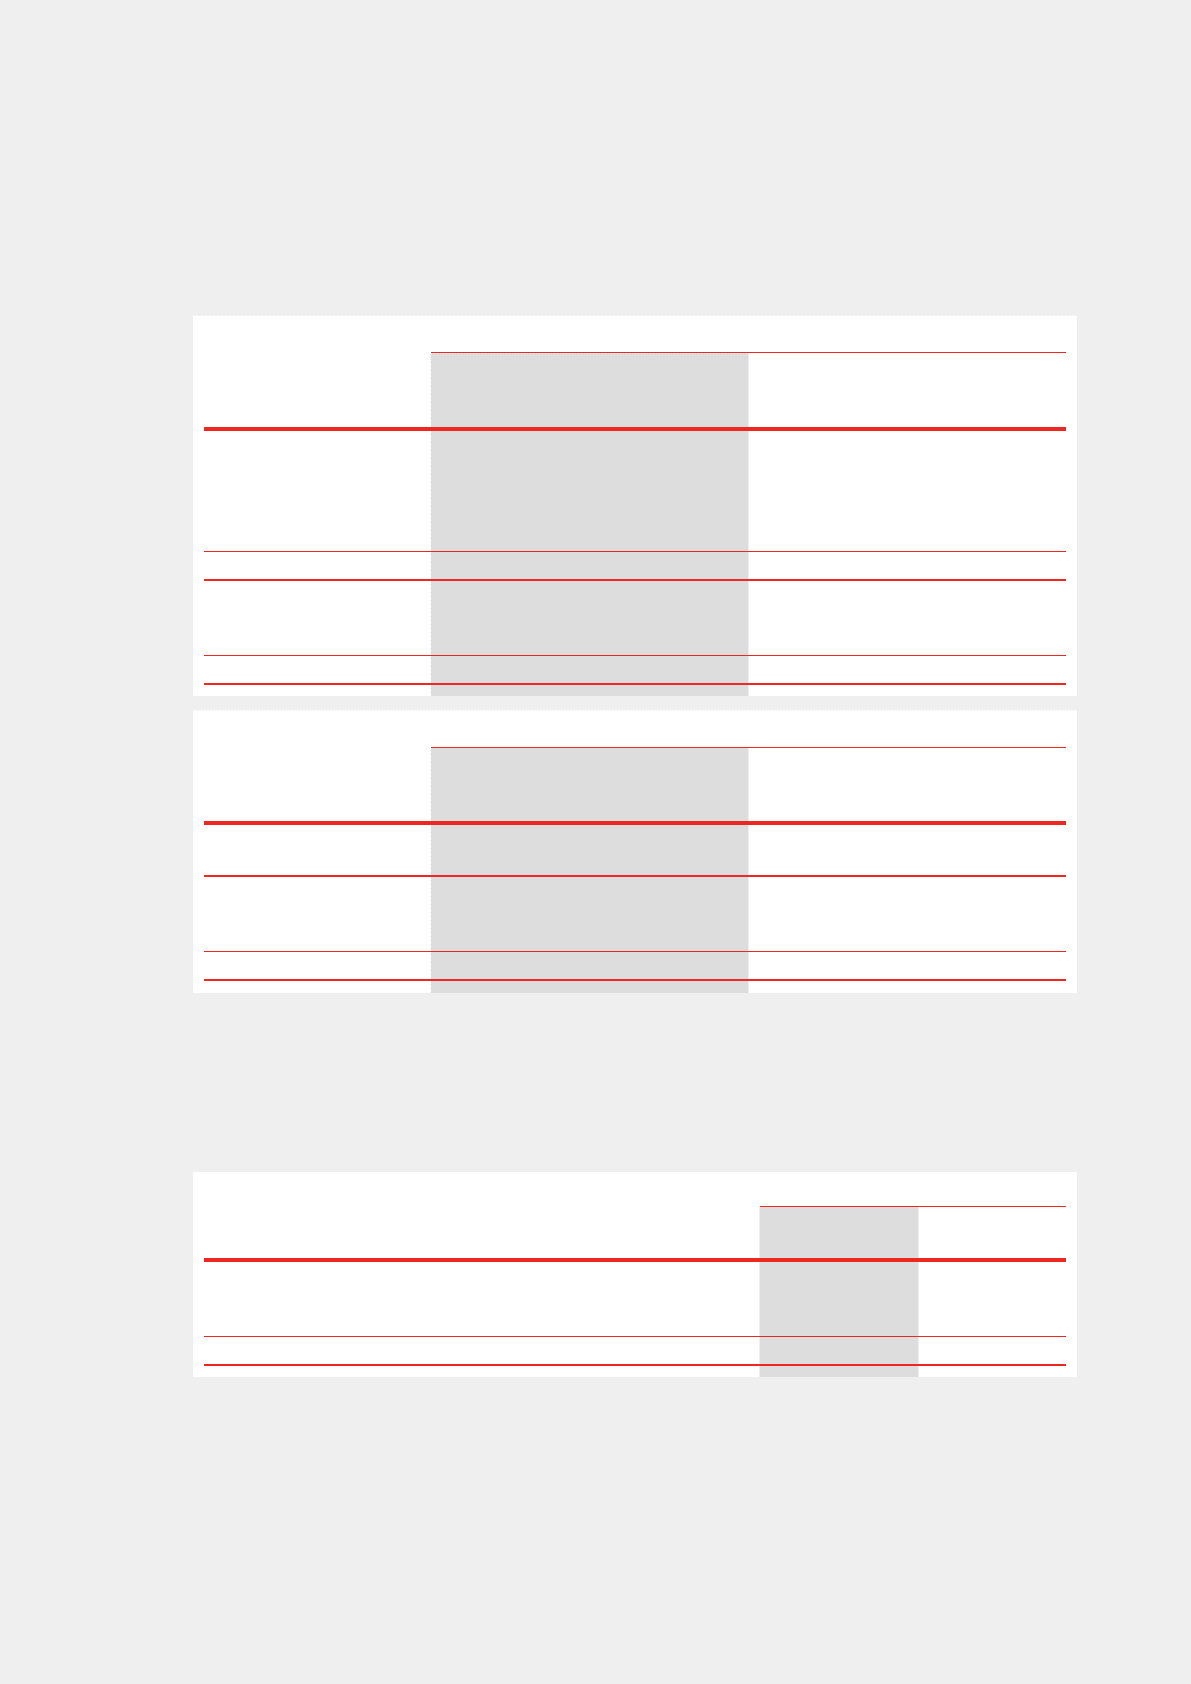
Company
2012 2011
Level 1 Level 2 Level 3 Total Level 1 Level 2 Level 3 Total
US$’000 US$’000 US$’000 US$’000 US$’000 US$’000 US$’000 US$’000
Assets
Derivative financial assets –953 –953 – – – –
Liabilities
Derivative financial liabilities –796 –796 –5,565 –5,565
Contingent considerations – – 256,093 256,093 – – – –
–796 256,093 256,889 –5,565 –5,565
There were no significant transfers of financial assets between Level 1 and Level 2 fair value hierarchy classification
during the years ended March 31, 2012 and 2011.
The movements in the financial assets and liabilities included in Level 3 fair value hierarchy for the years ended March
31, 2012 and 2011 are as follows:
Financial assets
Group
2012 2011
US$’000 US$’000
At the beginning of the year 2,216 2,095
Exchange adjustment 50 121
Additions 10,055 –
At the end of the year 12,321 2,216