Lenovo 2012 Annual Report Download - page 138
Download and view the complete annual report
Please find page 138 of the 2012 Lenovo annual report below. You can navigate through the pages in the report by either clicking on the pages listed below, or by using the keyword search tool below to find specific information within the annual report.-
 1
1 -
2
-
3
-
4
-
5
-
6
-
7
-
8
-
9
-
10
-
11
-
12
-
13
-
14
-
15
-
16
-
17
-
18
-
19
-
20
-
21
-
22
-
23
-
24
-
25
-
26
-
27
-
28
-
29
-
30
-
31
-
32
-
33
-
34
-
35
-
36
-
37
-
38
-
39
-
40
-
41
-
42
-
43
-
44
-
45
-
46
-
47
-
48
-
49
-
50
-
51
-
52
-
53
-
54
-
55
-
56
-
57
-
58
-
59
-
60
-
61
-
62
-
63
-
64
-
65
-
66
-
67
-
68
-
69
-
70
-
71
-
72
-
73
-
74
-
75
-
76
-
77
-
78
-
79
-
80
-
81
-
82
-
83
-
84
-
85
-
86
-
87
-
88
-
89
-
90
-
91
-
92
-
93
-
94
-
95
-
96
-
97
-
98
-
99
-
100
-
101
-
102
-
103
-
104
-
105
-
106
-
107
-
108
-
109
-
110
-
111
-
112
-
113
-
114
-
115
-
116
-
117
-
118
-
119
-
120
-
121
-
122
-
123
-
124
-
125
-
126
-
127
-
 128
128 -
 129
129 -
 130
130 -
 131
131 -
 132
132 -
 133
133 -
 134
134 -
 135
135 -
 136
136 -
 137
137 -
 138
138 -
 139
139 -
 140
140 -
 141
141 -
 142
142 -
 143
143 -
 144
144 -
 145
145 -
 146
146 -
 147
147 -
 148
148 -
149
-
150
-
151
-
152
-
153
-
154
-
155
-
156
-
157
-
158
-
159
-
160
-
161
-
162
-
163
-
164
-
165
-
166
-
167
-
168
-
169
-
170
-
171
-
172
-
173
-
174
-
175
-
176
-
177
-
178
-
179
-
180
 |
 |

2011/12 Annual Report Lenovo Group Limited
136
NOTES TO THE FINANCIAL STATEMENTS
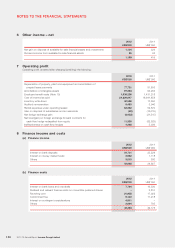
6 Other income – net
2012 2011
US$’000 US$’000
Net gain on disposal of available-for-sale financial assets and investments 1,104 326
Dividend income from available-for-sale financial assets 95 93
1,199 419
7 Operating profit
Operating profit is stated after charging/(crediting) the following:
2012 2011
US$’000 US$’000
Depreciation of property, plant and equipment and amortization of
prepaid lease payments 77,721 81,856
Amortization of intangible assets 97,684 94,284
Employee benefit costs (Note 10) 1,938,256 1,431,218
Cost of inventories sold 24,229,947 18,641,858
Inventory write-down 30,588 17,290
Auditor’s remuneration 5,483 3,940
Rental expenses under operating leases 63,252 52,670
Gain on disposal of subsidiaries and an associate (50) (13,015)
Net foreign exchange gain (4,653) (21,515)
Net loss/(gain) on foreign exchange forward contracts for
cash flow hedge reclassified from equity 11,338 (82,528)
Ineffectiveness on cash flow hedges 4,495 5,036
8 Finance income and costs
(a) Finance income
2012 2011
US$’000 US$’000
Interest on bank deposits 34,731 23,229
Interest on money market funds 2,952 1,118
Others 5,010 580
42,693 24,927
(b) Finance costs
2012 2011
US$’000 US$’000
Interest on bank loans and overdrafts 7,794 16,330
Dividend and relevant finance costs on convertible preferred shares –3,810
Factoring cost 21,955 17,022
Commitment fee 6,130 11,218
Interest on contingent considerations 4,911 –
Others 2,694 795
43,484 49,175