Lenovo 2012 Annual Report Download - page 129
Download and view the complete annual report
Please find page 129 of the 2012 Lenovo annual report below. You can navigate through the pages in the report by either clicking on the pages listed below, or by using the keyword search tool below to find specific information within the annual report.-
 1
1 -
2
-
3
-
4
-
5
-
6
-
7
-
8
-
9
-
10
-
11
-
12
-
13
-
14
-
15
-
16
-
17
-
18
-
19
-
20
-
21
-
22
-
23
-
24
-
25
-
26
-
27
-
28
-
29
-
30
-
31
-
32
-
33
-
34
-
35
-
36
-
37
-
38
-
39
-
40
-
41
-
42
-
43
-
44
-
45
-
46
-
47
-
48
-
49
-
50
-
51
-
52
-
53
-
54
-
55
-
56
-
57
-
58
-
59
-
60
-
61
-
62
-
63
-
64
-
65
-
66
-
67
-
68
-
69
-
70
-
71
-
72
-
73
-
74
-
75
-
76
-
77
-
78
-
79
-
80
-
81
-
82
-
83
-
84
-
85
-
86
-
87
-
88
-
89
-
90
-
91
-
92
-
93
-
94
-
95
-
96
-
97
-
98
-
99
-
100
-
101
-
102
-
103
-
104
-
105
-
106
-
107
-
108
-
109
-
110
-
111
-
112
-
113
-
114
-
115
-
116
-
117
-
118
-
 119
119 -
 120
120 -
 121
121 -
 122
122 -
 123
123 -
 124
124 -
 125
125 -
 126
126 -
 127
127 -
 128
128 -
 129
129 -
 130
130 -
 131
131 -
 132
132 -
 133
133 -
 134
134 -
 135
135 -
 136
136 -
 137
137 -
 138
138 -
 139
139 -
140
-
141
-
142
-
143
-
144
-
145
-
146
-
147
-
148
-
149
-
150
-
151
-
152
-
153
-
154
-
155
-
156
-
157
-
158
-
159
-
160
-
161
-
162
-
163
-
164
-
165
-
166
-
167
-
168
-
169
-
170
-
171
-
172
-
173
-
174
-
175
-
176
-
177
-
178
-
179
-
180
 |
 |

2011/12 Annual Report Lenovo Group Limited 127
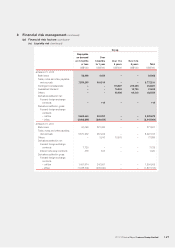
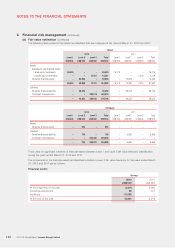
3 Financial risk management (continued)
(a) Financial risk factors (continued)
(iv) Liquidity risk (continued)
Group
Repayable
on demand
or 3 months
or less
Over
3 months
to 1 year
Over 1 to
3 years
Over 3 to
5 years Total
US$’000 US$’000 US$’000 US$’000 US$’000
At March 31, 2012
Bank loans 58,499 4,453 – – 62,952
Trade, notes and other payables
and accruals 7,856,295 916,516 – – 8,772,811
Contingent considerations – – 179,527 275,000 454,527
Guaranteed dividend – – 13,202 18,703 31,905
Others – – 93,038 89,018 182,056
Derivatives settled in net:
Forward foreign exchange
contracts –116 – – 116
Derivatives settled in gross:
Forward foreign exchange
contracts
– outflow 2,689,443 240,230 – – 2,929,673
– inflow (2,693,660) (249,404) – – (2,943,064)
At March 31, 2011
Bank loans 50,098 221,463 – – 271,561
Trade, notes and other payables
and accruals 5,570,502 357,222 – – 5,927,724
Others –3,913 73,976 –77,889
Derivatives settled in net:
Forward foreign exchange
contracts 7,725 – – – 7,725
Interest rate swap contracts 476 544 – – 1,020
Derivatives settled in gross:
Forward foreign exchange
contracts
– outflow 1,451,974 242,931 – – 1,694,905
– inflow (1,438,703) (239,040) – – (1,677,743)