Lenovo 2012 Annual Report Download - page 144
Download and view the complete annual report
Please find page 144 of the 2012 Lenovo annual report below. You can navigate through the pages in the report by either clicking on the pages listed below, or by using the keyword search tool below to find specific information within the annual report.-
 1
1 -
2
-
3
-
4
-
5
-
6
-
7
-
8
-
9
-
10
-
11
-
12
-
13
-
14
-
15
-
16
-
17
-
18
-
19
-
20
-
21
-
22
-
23
-
24
-
25
-
26
-
27
-
28
-
29
-
30
-
31
-
32
-
33
-
34
-
35
-
36
-
37
-
38
-
39
-
40
-
41
-
42
-
43
-
44
-
45
-
46
-
47
-
48
-
49
-
50
-
51
-
52
-
53
-
54
-
55
-
56
-
57
-
58
-
59
-
60
-
61
-
62
-
63
-
64
-
65
-
66
-
67
-
68
-
69
-
70
-
71
-
72
-
73
-
74
-
75
-
76
-
77
-
78
-
79
-
80
-
81
-
82
-
83
-
84
-
85
-
86
-
87
-
88
-
89
-
90
-
91
-
92
-
93
-
94
-
95
-
96
-
97
-
98
-
99
-
100
-
101
-
102
-
103
-
104
-
105
-
106
-
107
-
108
-
109
-
110
-
111
-
112
-
113
-
114
-
115
-
116
-
117
-
118
-
119
-
120
-
121
-
122
-
123
-
124
-
125
-
126
-
127
-
128
-
129
-
130
-
131
-
132
-
133
-
 134
134 -
 135
135 -
 136
136 -
 137
137 -
 138
138 -
 139
139 -
 140
140 -
 141
141 -
 142
142 -
 143
143 -
 144
144 -
 145
145 -
 146
146 -
 147
147 -
 148
148 -
 149
149 -
 150
150 -
 151
151 -
 152
152 -
 153
153 -
 154
154 -
155
-
156
-
157
-
158
-
159
-
160
-
161
-
162
-
163
-
164
-
165
-
166
-
167
-
168
-
169
-
170
-
171
-
172
-
173
-
174
-
175
-
176
-
177
-
178
-
179
-
180
 |
 |
2011/12 Annual Report Lenovo Group Limited
142
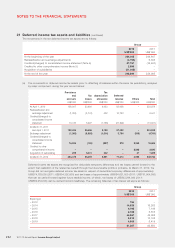
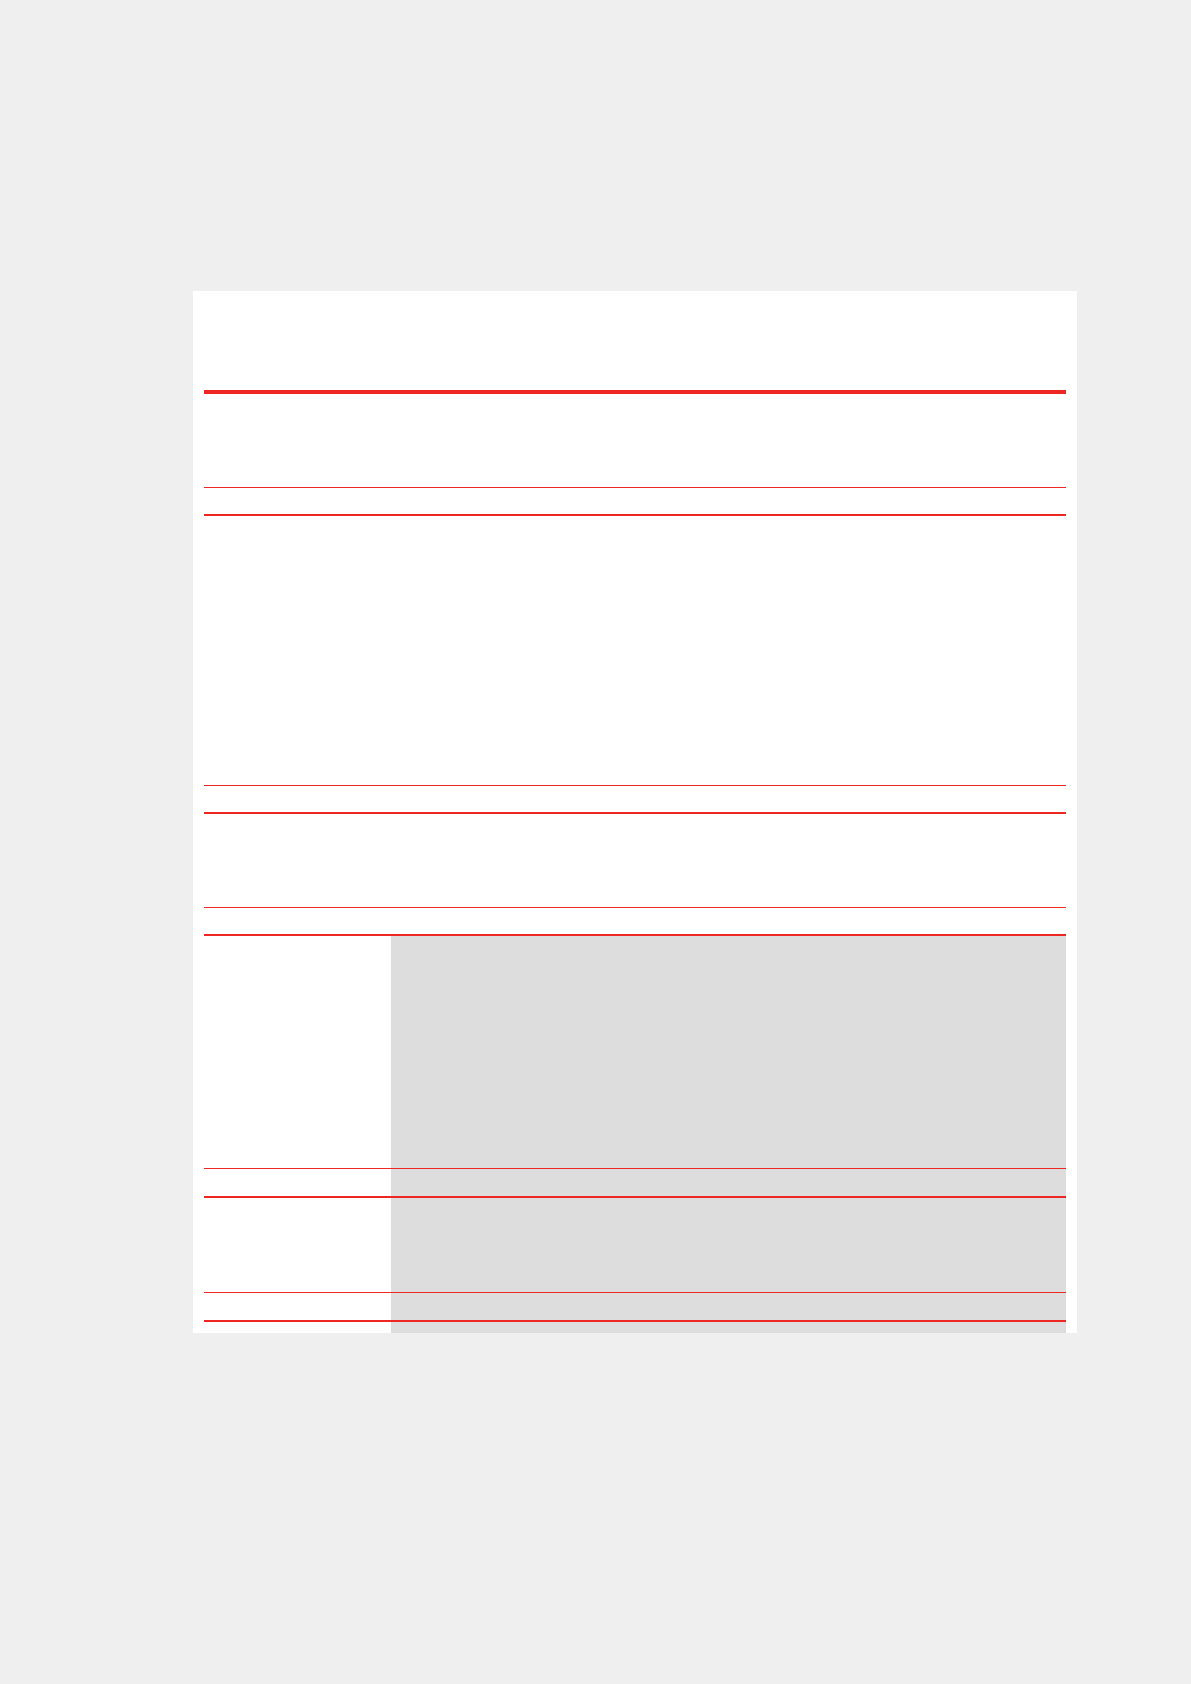
NOTES TO THE FINANCIAL STATEMENTS
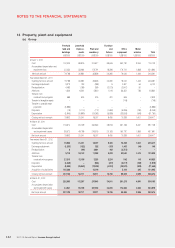
14 Property, plant and equipment
(a) Group
Freehold
land and
buildings
Leasehold
improve-
ments
Plant and
machinery
Furniture
and
fixtures
Office
equipment
Motor
vehicles Total
US$’000 US$’000 US$’000 US$’000 US$’000 US$’000 US$’000
At April 1, 2010
Cost 102,020 88,815 214,617 38,646 252,781 3,244 700,123
Accumulated depreciation and
impairment loss 22,252 53,934 178,791 18,286 176,761 1,838 451,862
Net book amount 79,768 34,881 35,826 20,360 76,020 1,406 248,261
Year ended March 31, 2011
Opening net book amount 79,768 34,881 35,826 20,360 76,020 1,406 248,261
Exchange adjustment 3,373 132 (289) 52,847 54 6,122
Reclassification 4,483 1,089 369 (3,075) (2,947) 81 –
Additions 1,320 6,544 5,820 1,016 33,351 783 48,834
Transfer from
construction-in-progress 688 604 515 491 525 –2,823
Transfer to intangible assets – – – – (748) –(748)
Transfer to prepaid lease
payments (5,866) – – – – – (5,866)
Disposals (19) (1,110) (172) (1,682) (5,086) (180) (8,249)
Depreciation (3,945) (10,899) (24,062) (8,685) (33,626) (543) (81,760)
Closing net book amount 79,802 31,241 18,007 8,430 70,336 1,601 209,417
At March 31, 2011
Cost 118,374 81,009 234,522 28,613 231,133 3,457 697,108
Accumulated depreciation
and impairment losses 38,572 49,768 216,515 20,183 160,797 1,856 487,691
Net book amount 79,802 31,241 18,007 8,430 70,336 1,601 209,417
Year ended March 31, 2012
Opening net book amount 79,802 31,241 18,007 8,430 70,336 1,601 209,417
Exchange adjustment (1,233) (122) 252 (107) 1,403 (44) 149
Reclassification 6(98) 3,681 168 (3,757) – –
Additions 5,719 24,143 11,288 5,033 53,540 1,515 101,238
Transfer from
construction-in-progress 27,213 12,196 3,223 2,234 542 115 45,523
Disposals (4,249) –(884) (201) (2,317) (165) (7,816)
Depreciation (5,522) (15,249) (12,402) (4,851) (38,570) (848) (77,442)
Acquisition of subsidiaries 105,386 –10,146 –5,478 395 121,405
Closing net book amount 207,122 52,111 33,311 10,706 86,655 2,569 392,474
At March 31, 2012
Cost 252,063 112,267 270,643 34,911 261,278 4,991 936,153
Accumulated depreciation
and impairment losses 44,941 60,156 237,332 24,205 174,623 2,422 543,679
Net book amount 207,122 52,111 33,311 10,706 86,655 2,569 392,474