Lenovo 2012 Annual Report Download - page 25
Download and view the complete annual report
Please find page 25 of the 2012 Lenovo annual report below. You can navigate through the pages in the report by either clicking on the pages listed below, or by using the keyword search tool below to find specific information within the annual report.-
 1
1 -
2
-
3
-
4
-
5
-
6
-
7
-
8
-
9
-
10
-
11
-
12
-
13
-
14
-
 15
15 -
 16
16 -
 17
17 -
 18
18 -
 19
19 -
 20
20 -
 21
21 -
 22
22 -
 23
23 -
 24
24 -
 25
25 -
 26
26 -
 27
27 -
 28
28 -
 29
29 -
 30
30 -
 31
31 -
 32
32 -
 33
33 -
 34
34 -
 35
35 -
36
-
37
-
38
-
39
-
40
-
41
-
42
-
43
-
44
-
45
-
46
-
47
-
48
-
49
-
50
-
51
-
52
-
53
-
54
-
55
-
56
-
57
-
58
-
59
-
60
-
61
-
62
-
63
-
64
-
65
-
66
-
67
-
68
-
69
-
70
-
71
-
72
-
73
-
74
-
75
-
76
-
77
-
78
-
79
-
80
-
81
-
82
-
83
-
84
-
85
-
86
-
87
-
88
-
89
-
90
-
91
-
92
-
93
-
94
-
95
-
96
-
97
-
98
-
99
-
100
-
101
-
102
-
103
-
104
-
105
-
106
-
107
-
108
-
109
-
110
-
111
-
112
-
113
-
114
-
115
-
116
-
117
-
118
-
119
-
120
-
121
-
122
-
123
-
124
-
125
-
126
-
127
-
128
-
129
-
130
-
131
-
132
-
133
-
134
-
135
-
136
-
137
-
138
-
139
-
140
-
141
-
142
-
143
-
144
-
145
-
146
-
147
-
148
-
149
-
150
-
151
-
152
-
153
-
154
-
155
-
156
-
157
-
158
-
159
-
160
-
161
-
162
-
163
-
164
-
165
-
166
-
167
-
168
-
169
-
170
-
171
-
172
-
173
-
174
-
175
-
176
-
177
-
178
-
179
-
180
 |
 |

2011/12 Annual Report Lenovo Group Limited 23
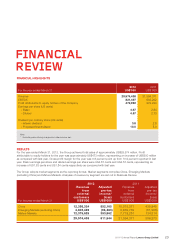
FINANCIAL
REVIEW
FINANCIAL HIGHLIGHTS
For the year ended March 31
2012
US$’000
2011
US$’000
Revenue 29,574,438 21,594,371
EBITDA1821,497 603,202
Profit attributable to equity holders of the Company 472,992 273,234
Earnings per share (US cents)
– Basic 4.67 2.84
– Diluted 4.57 2.73
Dividend per ordinary share (HK cents)
– Interim dividend 3.8 2.6
– Proposed final dividend 10.0 5.0
Note:
1 Excluding restructuring charges and other income, net.
RESULTS
For the year ended March 31, 2012, the Group achieved total sales of approximately US$29,574 million. Profit
attributable to equity holders for the year was approximately US$473 million, representing an increase of US$200 million
as compared with last year. Gross profit margin for the year was 0.8 percent point up from 10.9 percent reported in last
year. Basic earnings per share and diluted earnings per share were US4.67 cents and US4.57 cents, representing an
increase of US1.83 cents and US1.84 cents respectively as compared with last year.
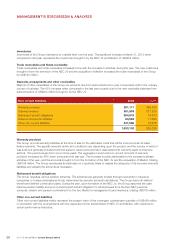
The Group adopts market segments as the reporting format. Market segments comprise China, Emerging Markets
(excluding China) and Mature Markets. Analyses of revenue by segment are set out in Business Review.
2012 2011
For the year ended March 31
Revenue
from
external
customers
US$’000
Adjusted
pre-tax
income/
(loss)
US$’000
Revenue
from
external
customers
US$’000
Adjusted
pre-tax
income/
(loss)
US$’000
China 12,395,324 552,165 10,015,371 435,945
Emerging Markets (excluding China) 4,803,489 (94,483) 3,859,739 (61,986)
Mature Markets 12,375,625 353,862 7,719,261 134,314
29,574,438 811,544 21,594,371 508,273