Lenovo 2012 Annual Report Download - page 178
Download and view the complete annual report
Please find page 178 of the 2012 Lenovo annual report below. You can navigate through the pages in the report by either clicking on the pages listed below, or by using the keyword search tool below to find specific information within the annual report.-
 1
1 -
2
-
3
-
4
-
5
-
6
-
7
-
8
-
9
-
10
-
11
-
12
-
13
-
14
-
15
-
16
-
17
-
18
-
19
-
20
-
21
-
22
-
23
-
24
-
25
-
26
-
27
-
28
-
29
-
30
-
31
-
32
-
33
-
34
-
35
-
36
-
37
-
38
-
39
-
40
-
41
-
42
-
43
-
44
-
45
-
46
-
47
-
48
-
49
-
50
-
51
-
52
-
53
-
54
-
55
-
56
-
57
-
58
-
59
-
60
-
61
-
62
-
63
-
64
-
65
-
66
-
67
-
68
-
69
-
70
-
71
-
72
-
73
-
74
-
75
-
76
-
77
-
78
-
79
-
80
-
81
-
82
-
83
-
84
-
85
-
86
-
87
-
88
-
89
-
90
-
91
-
92
-
93
-
94
-
95
-
96
-
97
-
98
-
99
-
100
-
101
-
102
-
103
-
104
-
105
-
106
-
107
-
108
-
109
-
110
-
111
-
112
-
113
-
114
-
115
-
116
-
117
-
118
-
119
-
120
-
121
-
122
-
123
-
124
-
125
-
126
-
127
-
128
-
129
-
130
-
131
-
132
-
133
-
134
-
135
-
136
-
137
-
138
-
139
-
140
-
141
-
142
-
143
-
144
-
145
-
146
-
147
-
148
-
149
-
150
-
151
-
152
-
153
-
154
-
155
-
156
-
157
-
158
-
159
-
160
-
161
-
162
-
163
-
164
-
165
-
166
-
167
-
 168
168 -
 169
169 -
 170
170 -
 171
171 -
 172
172 -
 173
173 -
 174
174 -
 175
175 -
 176
176 -
 177
177 -
 178
178 -
 179
179 -
 180
180
 |
 |

2011/12 Annual Report Lenovo Group Limited
176
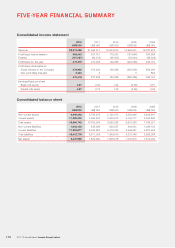
FIVE-YEAR FINANCIAL SUMMARY
Consolidated income statement
2012 2011 2010 2009 2008
US$’000 US$’000 US$’000 US$’000 US$’000
Revenue 29,574,438 21,594,371 16,604,815 14,900,931 16,787,872
Profit/(loss) before taxation 582,443 357,751 176,303 (187,945) 534,685
Taxation (107,027) (84,515) (46,935) (38,444) (49,528)
Profit/(loss) for the year 475,416 273,236 129,368 (226,389) 485,157
Profit/(loss) attributable to:
Equity holders of the Company 472,992 273,234 129,368 (226,392) 484,263
Non-controlling interests 2,424 2 – 3 894
475,416 273,236 129,368 (226,389) 485,157
Earnings/(loss) per share
Basic (US cents) 4.67 2.84 1.42 (2.56) 5.51
Diluted (US cents) 4.57 2.73 1.33 (2.56) 5.06
Consolidated balance sheet
2012 2011 2010 2009 2008
US$’000 US$’000 US$’000 US$’000 US$’000
Non-current assets 4,040,348 2,769,476 2,720,315 2,520,946 2,494,481
Current assets 11,820,400 7,936,463 6,235,613 4,100,717 5,044,840
Total assets 15,860,748 10,705,939 8,955,928 6,621,663 7,539,321
Non-current liabilities 1,603,102 838,386 930,557 844,221 1,098,123
Current liabilities 11,809,677 8,032,653 6,419,353 4,466,527 4,827,935
Total liabilities 13,412,779 8,871,039 7,349,910 5,310,748 5,926,058
Net assets 2,447,969 1,834,900 1,606,018 1,310,915 1,613,263