Lenovo 2012 Annual Report Download - page 27
Download and view the complete annual report
Please find page 27 of the 2012 Lenovo annual report below. You can navigate through the pages in the report by either clicking on the pages listed below, or by using the keyword search tool below to find specific information within the annual report.-
 1
1 -
2
-
3
-
4
-
5
-
6
-
7
-
8
-
9
-
10
-
11
-
12
-
13
-
14
-
15
-
16
-
 17
17 -
 18
18 -
 19
19 -
 20
20 -
 21
21 -
 22
22 -
 23
23 -
 24
24 -
 25
25 -
 26
26 -
 27
27 -
 28
28 -
 29
29 -
 30
30 -
 31
31 -
 32
32 -
 33
33 -
 34
34 -
 35
35 -
 36
36 -
 37
37 -
38
-
39
-
40
-
41
-
42
-
43
-
44
-
45
-
46
-
47
-
48
-
49
-
50
-
51
-
52
-
53
-
54
-
55
-
56
-
57
-
58
-
59
-
60
-
61
-
62
-
63
-
64
-
65
-
66
-
67
-
68
-
69
-
70
-
71
-
72
-
73
-
74
-
75
-
76
-
77
-
78
-
79
-
80
-
81
-
82
-
83
-
84
-
85
-
86
-
87
-
88
-
89
-
90
-
91
-
92
-
93
-
94
-
95
-
96
-
97
-
98
-
99
-
100
-
101
-
102
-
103
-
104
-
105
-
106
-
107
-
108
-
109
-
110
-
111
-
112
-
113
-
114
-
115
-
116
-
117
-
118
-
119
-
120
-
121
-
122
-
123
-
124
-
125
-
126
-
127
-
128
-
129
-
130
-
131
-
132
-
133
-
134
-
135
-
136
-
137
-
138
-
139
-
140
-
141
-
142
-
143
-
144
-
145
-
146
-
147
-
148
-
149
-
150
-
151
-
152
-
153
-
154
-
155
-
156
-
157
-
158
-
159
-
160
-
161
-
162
-
163
-
164
-
165
-
166
-
167
-
168
-
169
-
170
-
171
-
172
-
173
-
174
-
175
-
176
-
177
-
178
-
179
-
180
 |
 |

2011/12 Annual Report Lenovo Group Limited 25
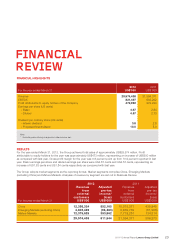
FINANCIAL POSITION
The balance sheet position of the Group remained strong, bank deposits and cash and cash equivalents increased by
US$1,174 million as compared to March 31, 2011. Total assets and total liabilities of the Group increased by 48 percent
and 51 percent respectively which is mainly attributable to the formation of the NEC JV and the acquisition of Medion
during the year. Further analyses of the Group’s major balance sheet items are set out below:
Non-current assets 2012 2011
Property, plant and equipment 392,474 209,417
Prepaid lease payments 13,552 9,682
Construction-in-progress 103,986 32,092
Intangible assets 3,091,205 2,134,452
Interests in associates and jointly controlled entities 3,410 914
Deferred income tax assets 332,493 251,098
Available-for-sale financial assets 71,946 78,689
Other non-current assets 31,282 53,132
4,040,348 2,769,476
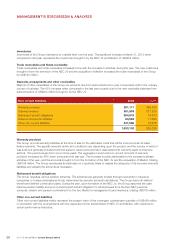
Property, plant and equipment and Prepaid lease payments
Property, plant and equipment and prepaid lease payments increased by 85% is mainly due to the completion of the
business combination activities during the year amounted to US$121 million. The completion of the manufacturing plant
in Chengdu, China also contributed to an increase of US$50 million.
Construction-in-progress
Construction-in-progress comprises mainly the Group’s investments in the headquarters in Beijing, China and the
information technology systems.
Intangible assets
Intangible assets comprise goodwill and other intangible assets including trademarks and trade names, and internal use
software. During the year, the Group completed the formation of the NEC JV and the acquisition of Medion. Goodwill and
other intangible assets including trademarks and trade names and customer relationships of US$581 million and US$349
million were recognized respectively.
Deferred income tax assets
Deferred income tax assets as at March 31, 2012 amounted to US$332 million, representing an increase of 32 percent
over last year, which is mainly attributable to temporary differences in relation to provisions, accruals and deferred
revenue arising in the normal course of business.
Current assets 2012 2011
Inventories 1,218,494 803,702
Trade receivables 2,354,909 1,368,924
Notes receivable 639,331 391,649
Derivative financial assets 62,883 13,295
Deposits, prepayments and other receivables 3,303,053 2,305,325
Income tax recoverable 70,406 56,912
Bank deposits 413,672 42,158
Cash and cash equivalents 3,757,652 2,954,498
11,820,400 7,936,463