Lenovo 2012 Annual Report Download - page 29
Download and view the complete annual report
Please find page 29 of the 2012 Lenovo annual report below. You can navigate through the pages in the report by either clicking on the pages listed below, or by using the keyword search tool below to find specific information within the annual report.-
 1
1 -
2
-
3
-
4
-
5
-
6
-
7
-
8
-
9
-
10
-
11
-
12
-
13
-
14
-
15
-
16
-
17
-
18
-
 19
19 -
 20
20 -
 21
21 -
 22
22 -
 23
23 -
 24
24 -
 25
25 -
 26
26 -
 27
27 -
 28
28 -
 29
29 -
 30
30 -
 31
31 -
 32
32 -
 33
33 -
 34
34 -
 35
35 -
 36
36 -
 37
37 -
 38
38 -
 39
39 -
40
-
41
-
42
-
43
-
44
-
45
-
46
-
47
-
48
-
49
-
50
-
51
-
52
-
53
-
54
-
55
-
56
-
57
-
58
-
59
-
60
-
61
-
62
-
63
-
64
-
65
-
66
-
67
-
68
-
69
-
70
-
71
-
72
-
73
-
74
-
75
-
76
-
77
-
78
-
79
-
80
-
81
-
82
-
83
-
84
-
85
-
86
-
87
-
88
-
89
-
90
-
91
-
92
-
93
-
94
-
95
-
96
-
97
-
98
-
99
-
100
-
101
-
102
-
103
-
104
-
105
-
106
-
107
-
108
-
109
-
110
-
111
-
112
-
113
-
114
-
115
-
116
-
117
-
118
-
119
-
120
-
121
-
122
-
123
-
124
-
125
-
126
-
127
-
128
-
129
-
130
-
131
-
132
-
133
-
134
-
135
-
136
-
137
-
138
-
139
-
140
-
141
-
142
-
143
-
144
-
145
-
146
-
147
-
148
-
149
-
150
-
151
-
152
-
153
-
154
-
155
-
156
-
157
-
158
-
159
-
160
-
161
-
162
-
163
-
164
-
165
-
166
-
167
-
168
-
169
-
170
-
171
-
172
-
173
-
174
-
175
-
176
-
177
-
178
-
179
-
180
 |
 |

2011/12 Annual Report Lenovo Group Limited 27
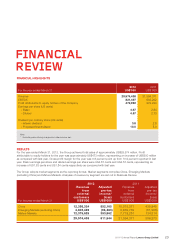
Current liabilities 2012 2011
Trade payables 4,050,272 2,179,839
Notes payable 127,315 98,964
Derivative financial liabilities 49,253 39,223
Provisions, accruals and other payables 7,074,196 5,100,562
Deferred revenue 310,159 245,793
Income tax payable 135,530 96,711
Bank borrowings 62,952 271,561
11,809,677 8,032,653
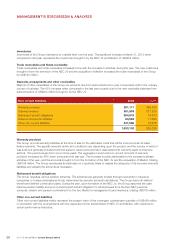
Trade payables and Notes payable
Trade payables and notes payable increased in line with the increase in activities during the year. The new vendor
balances brought in from the formation of the NEC JV and the acquisition of Medion increased the trade payable of the
Group by US$601 million.
Provisions, accruals and other payables
Provisions comprise warranty liabilities (due within one year), restructuring and environmental restoration. Accruals also
include the allowance for billing adjustments relates primarily to allowance for future volume discounts, price protection,
rebates, and customer sales returns. Majority of other payables are obligations to pay for finished goods that have been
acquired in the ordinary course of business from subcontractors. Provisions, accruals and other payables increased by
39% when compared with last year. The increase is partly attributable to the increase business activities of the year, and
the amounts brought in from the formation of the NEC JV and the acquisition of Medion totaling US$725 million.
Bank borrowings
The US$200 million term loans have been repaid in March 2012.
CAPITAL EXPENDITURE
The Group incurred capital expenditure of US$329 million (2011: US$148 million) during the year ended March 31, 2012,
mainly for the acquisition of office equipment, completion of construction-in-progress and investments in the Group’s
information technology systems.
LIQUIDITY AND FINANCIAL RESOURCES
At March 31, 2012, total assets of the Group amounted to US$15,861 million (2011: US$10,706 million), which were
financed by equity attributable to owners of the Company of US$2,361 million (2011: US$1,835 million), non-controlling
interests of US$87 million (2011: US$179,000), and total liabilities of US$13,413 million (2011: US$8,871 million). At March
31, 2012, the current ratio of the Group was 1.0 (2011: 0.99).
The Group had a solid financial position and continued to maintain a strong and steady cash inflow from its operating
activities. At March 31, 2012, bank deposits, cash and cash equivalents totaled US$4,171 million (2011: US$2,997 million),
of which 56.9 (2011: 53.9) percent was denominated in US dollars, 27.6 (2011: 37.1) percent in Renminbi, 7.7 (2011: 0.7)
percent in Euros, 3.5 (2011: 0.4) percent in Japanese Yen, and 4.3 (2011: 7.9) percent in other currencies.
The Group adopts a conservative policy to invest the surplus cash generated from operations. At March 31, 2012, 74.2
(2011: 75.6) percent of cash are bank deposits, and 25.8 (2011: 24.4) percent of cash are investments in liquid money
market funds of investment grade.
Although the Group has consistently maintained a very liquid position, banking facilities have nevertheless been put in place
for contingency purposes.