Lenovo 2012 Annual Report Download - page 164
Download and view the complete annual report
Please find page 164 of the 2012 Lenovo annual report below. You can navigate through the pages in the report by either clicking on the pages listed below, or by using the keyword search tool below to find specific information within the annual report.-
 1
1 -
2
-
3
-
4
-
5
-
6
-
7
-
8
-
9
-
10
-
11
-
12
-
13
-
14
-
15
-
16
-
17
-
18
-
19
-
20
-
21
-
22
-
23
-
24
-
25
-
26
-
27
-
28
-
29
-
30
-
31
-
32
-
33
-
34
-
35
-
36
-
37
-
38
-
39
-
40
-
41
-
42
-
43
-
44
-
45
-
46
-
47
-
48
-
49
-
50
-
51
-
52
-
53
-
54
-
55
-
56
-
57
-
58
-
59
-
60
-
61
-
62
-
63
-
64
-
65
-
66
-
67
-
68
-
69
-
70
-
71
-
72
-
73
-
74
-
75
-
76
-
77
-
78
-
79
-
80
-
81
-
82
-
83
-
84
-
85
-
86
-
87
-
88
-
89
-
90
-
91
-
92
-
93
-
94
-
95
-
96
-
97
-
98
-
99
-
100
-
101
-
102
-
103
-
104
-
105
-
106
-
107
-
108
-
109
-
110
-
111
-
112
-
113
-
114
-
115
-
116
-
117
-
118
-
119
-
120
-
121
-
122
-
123
-
124
-
125
-
126
-
127
-
128
-
129
-
130
-
131
-
132
-
133
-
134
-
135
-
136
-
137
-
138
-
139
-
140
-
141
-
142
-
143
-
144
-
145
-
146
-
147
-
148
-
149
-
150
-
151
-
152
-
153
-
 154
154 -
 155
155 -
 156
156 -
 157
157 -
 158
158 -
 159
159 -
 160
160 -
 161
161 -
 162
162 -
 163
163 -
 164
164 -
 165
165 -
 166
166 -
 167
167 -
 168
168 -
 169
169 -
 170
170 -
 171
171 -
 172
172 -
 173
173 -
 174
174 -
175
-
176
-
177
-
178
-
179
-
180
 |
 |

2011/12 Annual Report Lenovo Group Limited
162
NOTES TO THE FINANCIAL STATEMENTS
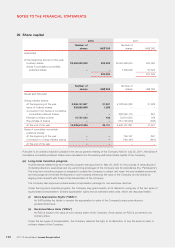
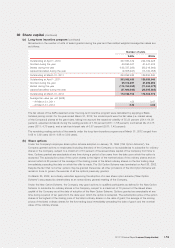
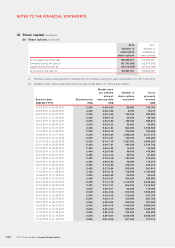
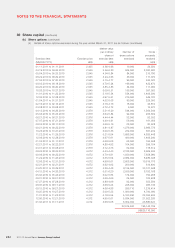
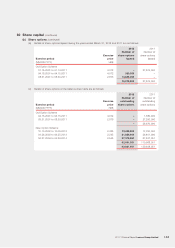
30 Share capital (continued)
(b) Share options (continued)
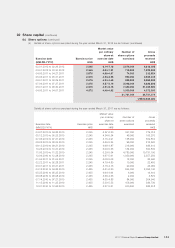
(ii) Details of share options exercised during the year ended March 31, 2011 are as follows: (continued)
Exercise date Exercise price
Market value
per ordinary
share at
exercise date
Number of
share options
exercised
Gross
proceeds
received
(MM.DD.YYYY) HK$ HK$ HK$
01.11.2011 to 01.11.2011 2.435 4.68-4.68 10,000 24,350
04.19.2010 to 04.26.2010 2.545 5.64-6.20 904,000 2,300,680
05.04.2010 to 05.25.2010 2.545 4.64-5.84 84,000 213,780
06.22.2010 to 06.29.2010 2.545 4.24-4.63 46,000 117,070
07.05.2010 to 07.20.2010 2.545 4.15-4.77 96,000 244,320
08.03.2010 to 08.18.2010 2.545 4.79-5.24 166,000 422,470
09.20.2010 to 09.20.2010 2.545 4.85-4.85 44,000 111,980
10.26.2010 to 10.27.2010 2.545 5.09-5.31 156,000 397,020
11.01.2010 to 11.22.2010 2.545 5.18-5.54 554,000 1,409,930
12.06.2010 to 12.28.2010 2.545 4.97-5.61 216,000 549,720
01.04.2011 to 01.31.2011 2.545 4.52-5.08 90,000 229,050
02.16.2011 to 02.16.2011 2.545 4.76-4.76 18,000 45,810
03.08.2011 to 03.08.2011 2.545 4.72-4.72 6,000 15,270
04.13.2010 to 04.26.2010 2.876 5.51-6.20 544,000 1,564,544
05.04.2010 to 05.25.2010 2.876 4.64-5.84 92,000 264,592
06.21.2010 to 06.21.2010 2.876 4.44-4.44 32,000 92,032
07.07.2010 to 07.21.2010 2.876 4.40-4.91 56,000 161,056
08.04.2010 to 08.11.2010 2.876 4.66-5.19 28,000 80,528
09.21.2010 to 09.22.2010 2.876 4.81-4.87 1,276,000 3,669,776
10.25.2010 to 10.27.2010 2.876 5.09-5.33 232,000 667,232
11.22.2010 to 11.29.2010 2.876 5.21-5.54 1,698,000 4,883,448
12.06.2010 to 12.28.2010 2.876 4.97-5.61 490,000 1,409,240
01.04.2011 to 01.11.2011 2.876 4.68-5.08 68,000 195,568
02.21.2011 to 02.22.2011 2.876 4.80-4.92 104,000 299,104
03.01.2011 to 03.08.2011 2.876 4.72-4.75 62,000 178,312
08.25.2010 to 08.25.2010 4.072 4.43-4.43 2,188,000 8,909,536
09.06.2010 to 09.22.2010 4.072 4.70-4.81 1,930,000 7,858,960
11.22.2010 to 11.23.2010 4.072 5.35-5.54 2,084,000 8,486,048
12.06.2010 to 12.31.2010 4.072 4.98-5.61 2,608,000 10,619,776
02.21.2011 to 02.21.2011 4.072 4.92-4.92 200,000 814,400
03.23.2011 to 03.29.2011 4.072 4.26-4.48 8,134,000 33,121,648
04.13.2010 to 04.26.2010 4.312 5.51-6.20 2,039,000 8,792,168
05.04.2010 to 05.24.2010 4.312 5.02-5.84 174,000 750,288
06.01.2010 to 06.01.2010 4.312 4.66-4.66 24,000 103,488
07.27.2010 to 07.28.2010 4.312 4.88-4.96 82,000 353,584
08.03.2010 to 08.11.2010 4.312 4.66-5.24 228,000 983,136
09.13.2010 to 09.27.2010 4.312 4.66-4.88 296,710 1,279,414
10.25.2010 to 10.27.2010 4.312 5.09-5.33 1,090,000 4,700,080
11.01.2010 to 11.22.2010 4.312 5.18-5.54 5,193,290 22,393,466
12.06.2010 to 12.21.2010 4.312 4.95-5.61 5,084,000 21,922,208
01.04.2011 to 01.11.2011 4.312 4.68-5.08 6,002,000 25,880,624
52,614,500 195,145,709
US$25,116,000