Lenovo 2012 Annual Report Download - page 5
Download and view the complete annual report
Please find page 5 of the 2012 Lenovo annual report below. You can navigate through the pages in the report by either clicking on the pages listed below, or by using the keyword search tool below to find specific information within the annual report.-
 1
1 -
 2
2 -
 3
3 -
 4
4 -
 5
5 -
 6
6 -
 7
7 -
 8
8 -
 9
9 -
 10
10 -
 11
11 -
 12
12 -
 13
13 -
 14
14 -
 15
15 -
 16
16 -
17
-
18
-
19
-
20
-
21
-
22
-
23
-
24
-
25
-
26
-
27
-
28
-
29
-
30
-
31
-
32
-
33
-
34
-
35
-
36
-
37
-
38
-
39
-
40
-
41
-
42
-
43
-
44
-
45
-
46
-
47
-
48
-
49
-
50
-
51
-
52
-
53
-
54
-
55
-
56
-
57
-
58
-
59
-
60
-
61
-
62
-
63
-
64
-
65
-
66
-
67
-
68
-
69
-
70
-
71
-
72
-
73
-
74
-
75
-
76
-
77
-
78
-
79
-
80
-
81
-
82
-
83
-
84
-
85
-
86
-
87
-
88
-
89
-
90
-
91
-
92
-
93
-
94
-
95
-
96
-
97
-
98
-
99
-
100
-
101
-
102
-
103
-
104
-
105
-
106
-
107
-
108
-
109
-
110
-
111
-
112
-
113
-
114
-
115
-
116
-
117
-
118
-
119
-
120
-
121
-
122
-
123
-
124
-
125
-
126
-
127
-
128
-
129
-
130
-
131
-
132
-
133
-
134
-
135
-
136
-
137
-
138
-
139
-
140
-
141
-
142
-
143
-
144
-
145
-
146
-
147
-
148
-
149
-
150
-
151
-
152
-
153
-
154
-
155
-
156
-
157
-
158
-
159
-
160
-
161
-
162
-
163
-
164
-
165
-
166
-
167
-
168
-
169
-
170
-
171
-
172
-
173
-
174
-
175
-
176
-
177
-
178
-
179
-
180
 |
 |
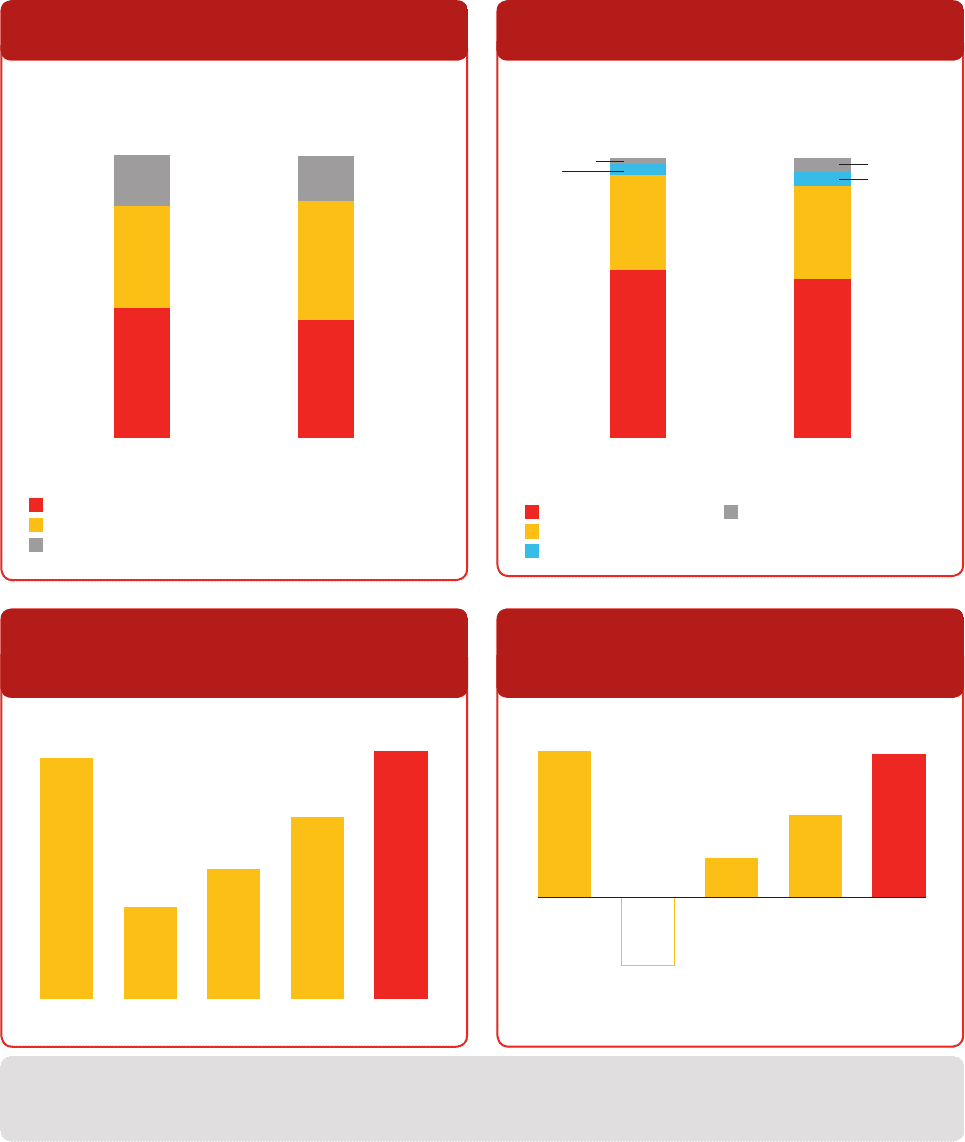
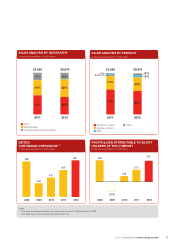
2011/12 Annual Report Lenovo Group Limited 3
Notes:
1 Excluding discontinued operations for the period from April 1, 2006 to March 31, 2008.
2 Excluding restructuring charges and other income, net.
SALES ANALYSIS BY GEOGRAPHY
EBITDA
CONTINUING OPERATIONS1, 2
for the year ended March 31 (US$ million)
SALES ANALYSIS BY PRODUCT
PROFIT/(LOSS) ATTRIBUTABLE TO EQUITY
HOLDERS OF THE COMPANY
for the year ended March 31 (US$ million)
21,594 21,594
29,574 29,574
2011 20112012 2012
for the year ended March 31 (US$ million) for the year ended March 31 (US$ million)
China
Mature Markets
Emerging Markets (excluding China)
Notebook computer
Desktop computer
MIDH
Others
46%
60%
42% 57%
36%
34%
42%
33%
18% 2%
4%
16% 5%
5%
603
821
432
305
798
201220112008 2009 2010
273
473
129
(226)
484
201220112008 2009 2010