Lenovo 2012 Annual Report Download - page 151
Download and view the complete annual report
Please find page 151 of the 2012 Lenovo annual report below. You can navigate through the pages in the report by either clicking on the pages listed below, or by using the keyword search tool below to find specific information within the annual report.-
 1
1 -
2
-
3
-
4
-
5
-
6
-
7
-
8
-
9
-
10
-
11
-
12
-
13
-
14
-
15
-
16
-
17
-
18
-
19
-
20
-
21
-
22
-
23
-
24
-
25
-
26
-
27
-
28
-
29
-
30
-
31
-
32
-
33
-
34
-
35
-
36
-
37
-
38
-
39
-
40
-
41
-
42
-
43
-
44
-
45
-
46
-
47
-
48
-
49
-
50
-
51
-
52
-
53
-
54
-
55
-
56
-
57
-
58
-
59
-
60
-
61
-
62
-
63
-
64
-
65
-
66
-
67
-
68
-
69
-
70
-
71
-
72
-
73
-
74
-
75
-
76
-
77
-
78
-
79
-
80
-
81
-
82
-
83
-
84
-
85
-
86
-
87
-
88
-
89
-
90
-
91
-
92
-
93
-
94
-
95
-
96
-
97
-
98
-
99
-
100
-
101
-
102
-
103
-
104
-
105
-
106
-
107
-
108
-
109
-
110
-
111
-
112
-
113
-
114
-
115
-
116
-
117
-
118
-
119
-
120
-
121
-
122
-
123
-
124
-
125
-
126
-
127
-
128
-
129
-
130
-
131
-
132
-
133
-
134
-
135
-
136
-
137
-
138
-
139
-
140
-
 141
141 -
 142
142 -
 143
143 -
 144
144 -
 145
145 -
 146
146 -
 147
147 -
 148
148 -
 149
149 -
 150
150 -
 151
151 -
 152
152 -
 153
153 -
 154
154 -
 155
155 -
 156
156 -
 157
157 -
 158
158 -
 159
159 -
 160
160 -
 161
161 -
162
-
163
-
164
-
165
-
166
-
167
-
168
-
169
-
170
-
171
-
172
-
173
-
174
-
175
-
176
-
177
-
178
-
179
-
180
 |
 |

2011/12 Annual Report Lenovo Group Limited 149
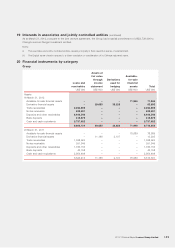
19 Interests in associates and jointly controlled entities (continued)
As at March 31, 2012, pursuant to the joint venture agreement, the Group had a capital commitment of US$3,736,000 to
Chengdu Lenovo Rongjin Investment Limited.
Notes:
(i) The associates and jointly controlled entities operate principally in their respective places of establishment.
(ii) The English name of each company is a direct translation or transliteration of its Chinese registered name.
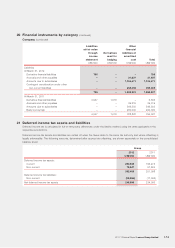
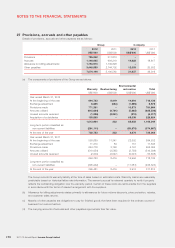
20 Financial instruments by category
Group
Loans and
receivables
Assets at
fair value
through
income
statement
Derivatives
used for
hedging
Available-
for-sale
financial
assets Total
US$’000 US$’000 US$’000 US$’000 US$’000
Assets
At March 31, 2012
Available-for-sale financial assets –––71,946 71,946
Derivative financial assets –29,655 33,228 –62,883
Trade receivables 2,354,909 – – – 2,354,909
Notes receivable 639,331 –––639,331
Deposits and other receivables 2,443,540 –––2,443,540
Bank deposits 413,672 – – – 413,672
Cash and cash equivalents 3,757,652 – – – 3,757,652
9,609,104 29,655 33,228 71,946 9,743,933
At March 31, 2011
Available-for-sale financial assets –––78,689 78,689
Derivative financial assets –11,188 2,107 –13,295
Trade receivables 1,368,924 – – – 1,368,924
Notes receivable 391,649 –––391,649
Deposits and other receivables 1,766,184 –––1,766,184
Bank deposits 42,158 – – – 42,158
Cash and cash equivalents 2,954,498 – – – 2,954,498
6,523,413 11,188 2,107 78,689 6,615,397