Lenovo 2012 Annual Report Download - page 174
Download and view the complete annual report
Please find page 174 of the 2012 Lenovo annual report below. You can navigate through the pages in the report by either clicking on the pages listed below, or by using the keyword search tool below to find specific information within the annual report.-
 1
1 -
2
-
3
-
4
-
5
-
6
-
7
-
8
-
9
-
10
-
11
-
12
-
13
-
14
-
15
-
16
-
17
-
18
-
19
-
20
-
21
-
22
-
23
-
24
-
25
-
26
-
27
-
28
-
29
-
30
-
31
-
32
-
33
-
34
-
35
-
36
-
37
-
38
-
39
-
40
-
41
-
42
-
43
-
44
-
45
-
46
-
47
-
48
-
49
-
50
-
51
-
52
-
53
-
54
-
55
-
56
-
57
-
58
-
59
-
60
-
61
-
62
-
63
-
64
-
65
-
66
-
67
-
68
-
69
-
70
-
71
-
72
-
73
-
74
-
75
-
76
-
77
-
78
-
79
-
80
-
81
-
82
-
83
-
84
-
85
-
86
-
87
-
88
-
89
-
90
-
91
-
92
-
93
-
94
-
95
-
96
-
97
-
98
-
99
-
100
-
101
-
102
-
103
-
104
-
105
-
106
-
107
-
108
-
109
-
110
-
111
-
112
-
113
-
114
-
115
-
116
-
117
-
118
-
119
-
120
-
121
-
122
-
123
-
124
-
125
-
126
-
127
-
128
-
129
-
130
-
131
-
132
-
133
-
134
-
135
-
136
-
137
-
138
-
139
-
140
-
141
-
142
-
143
-
144
-
145
-
146
-
147
-
148
-
149
-
150
-
151
-
152
-
153
-
154
-
155
-
156
-
157
-
158
-
159
-
160
-
161
-
162
-
163
-
 164
164 -
 165
165 -
 166
166 -
 167
167 -
 168
168 -
 169
169 -
 170
170 -
 171
171 -
 172
172 -
 173
173 -
 174
174 -
 175
175 -
 176
176 -
 177
177 -
 178
178 -
 179
179 -
 180
180
 |
 |

2011/12 Annual Report Lenovo Group Limited
172
NOTES TO THE FINANCIAL STATEMENTS
37 Business combinations (continued)
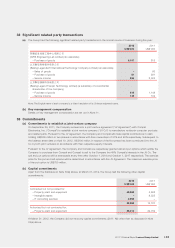
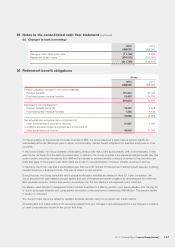
(c) Net cash outflow from acquisitions of subsidiaries
US$’000
Purchase consideration settled in cash 537,612
Less: Cash and cash equivalents in subsidiaries acquired (365,296)
Acquisition of subsidiaries, net of cash acquired 172,316
(d) Impact of acquisitions on the results of the Group
The aggregated revenue of newly acquired businesses included in the consolidated income statement since their
respective dates of acquisition and up to March 31, 2012 were US$3,421 million. The newly acquired businesses also
contributed an aggregated profit before taxation of US$101 million over the same period.
Had both newly acquired businesses been consolidated from April 1, 2011, the beginning of the financial year, the
consolidated income statement would show revenue of US$30,163 million and profit before taxation of US$587 million.
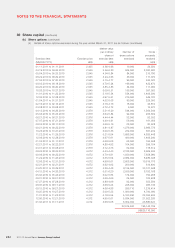
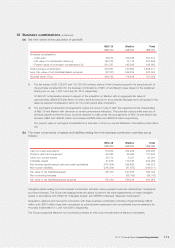
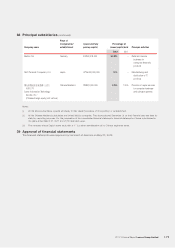
38 Principal subsidiaries
The following includes the principal subsidiaries directly or indirectly held by the Company and, in the opinion of the directors,
are significant to the results of the year or form a substantial portion of the net assets of the Group. The directors consider
that giving details of other subsidiaries would result in particulars of excessive length.
Company name
Place of
incorporation/
establishment
Issued and fully
paid up capital
Percentage of
issued capital held Principal activities
2012 2011
Held directly:
聯想(北京)有限公司
(Lenovo (Beijing) Limited)1
(wholly foreign-owned enterprise)
Chinese Mainland HK$175,481,300 100% 100% Manufacturing and
distribution of IT
products and
provision of IT
services
聯想(上海)有限公司
(Lenovo (Shanghai) Co., Ltd.)1
(wholly foreign-owned enterprise)
Chinese Mainland HK$10,000,000 100% 100% Distribution of IT
products and
provision of IT
services
Held indirectly:
Lenovo (Asia Pacific) Limited Hong Kong HK$1,225,130,735 100% 100% Investment holding
and distribution of IT
products
北京聯想軟件有限公司
(Beijing Lenovo Software Limited)1
(wholly foreign-owned enterprise)
Chinese Mainland HK$5,000,000 100% 100% Provision of IT
services and
distribution of IT
products
Lenovo (Australia & New Zealand)
Pty Limited
Australia AUD36,272,716 100% 100% Distribution of IT
products
Lenovo (Belgium) BVBA Belgium EUR252,619,458.46 100% 100% Investment holding
and distribution of IT
products
Lenovo (Canada) Inc. Canada CAD10,000,000 100% 100% Distribution of IT
products