Lenovo 2012 Annual Report Download - page 153
Download and view the complete annual report
Please find page 153 of the 2012 Lenovo annual report below. You can navigate through the pages in the report by either clicking on the pages listed below, or by using the keyword search tool below to find specific information within the annual report.-
 1
1 -
2
-
3
-
4
-
5
-
6
-
7
-
8
-
9
-
10
-
11
-
12
-
13
-
14
-
15
-
16
-
17
-
18
-
19
-
20
-
21
-
22
-
23
-
24
-
25
-
26
-
27
-
28
-
29
-
30
-
31
-
32
-
33
-
34
-
35
-
36
-
37
-
38
-
39
-
40
-
41
-
42
-
43
-
44
-
45
-
46
-
47
-
48
-
49
-
50
-
51
-
52
-
53
-
54
-
55
-
56
-
57
-
58
-
59
-
60
-
61
-
62
-
63
-
64
-
65
-
66
-
67
-
68
-
69
-
70
-
71
-
72
-
73
-
74
-
75
-
76
-
77
-
78
-
79
-
80
-
81
-
82
-
83
-
84
-
85
-
86
-
87
-
88
-
89
-
90
-
91
-
92
-
93
-
94
-
95
-
96
-
97
-
98
-
99
-
100
-
101
-
102
-
103
-
104
-
105
-
106
-
107
-
108
-
109
-
110
-
111
-
112
-
113
-
114
-
115
-
116
-
117
-
118
-
119
-
120
-
121
-
122
-
123
-
124
-
125
-
126
-
127
-
128
-
129
-
130
-
131
-
132
-
133
-
134
-
135
-
136
-
137
-
138
-
139
-
140
-
141
-
142
-
 143
143 -
 144
144 -
 145
145 -
 146
146 -
 147
147 -
 148
148 -
 149
149 -
 150
150 -
 151
151 -
 152
152 -
 153
153 -
 154
154 -
 155
155 -
 156
156 -
 157
157 -
 158
158 -
 159
159 -
 160
160 -
 161
161 -
 162
162 -
 163
163 -
164
-
165
-
166
-
167
-
168
-
169
-
170
-
171
-
172
-
173
-
174
-
175
-
176
-
177
-
178
-
179
-
180
 |
 |

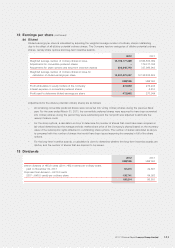
2011/12 Annual Report Lenovo Group Limited 151
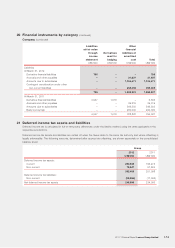
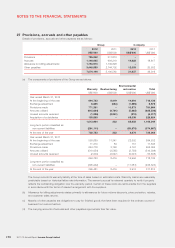
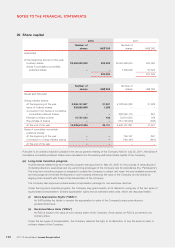
20 Financial instruments by category (continued)
Company (continued)
Liabilities
at fair value
through
income
statement
Derivatives
used for
hedging
Other
financial
liabilities at
amortized
cost Total
US$’000 US$’000 US$’000 US$’000
Liabilities
At March 31, 2012
Derivative financial liabilities 796 – – 796
Accruals and other payables – – 31,637 31,637
Amounts due to subsidiaries – – 1,104,471 1,104,471
Contingent consideration under other
non-current liabilities – – 256,093 256,093
796 –1,392,201 1,392,997
At March 31, 2011
Derivative financial liabilities 4,547 1,018 –5,565
Accruals and other payables – – 39,319 39,319
Amounts due to subsidiaries – – 549,503 549,503
Bank borrowings – – 200,000 200,000
4,547 1,018 788,822 794,387
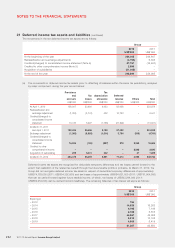
21 Deferred income tax assets and liabilities
Deferred income tax is calculated in full on temporary differences under the liability method using the rates applicable in the
respective jurisdictions.
Deferred income tax assets and liabilities are netted off when the taxes relate to the same tax authority and where offsetting is
legally enforceable. The following amounts, determined after appropriate offsetting, are shown separately on the consolidated
balance sheet:
Group
2012 2011
US$’000 US$’000
Deferred income tax assets:
Current 252,946 193,274
Non-current 79,547 57,824
332,493 251,098
Deferred income tax liabilities:
Non-current (83,594) (17,093)
Net deferred income tax assets 248,899 234,005