Lenovo 2012 Annual Report Download - page 171
Download and view the complete annual report
Please find page 171 of the 2012 Lenovo annual report below. You can navigate through the pages in the report by either clicking on the pages listed below, or by using the keyword search tool below to find specific information within the annual report.-
 1
1 -
2
-
3
-
4
-
5
-
6
-
7
-
8
-
9
-
10
-
11
-
12
-
13
-
14
-
15
-
16
-
17
-
18
-
19
-
20
-
21
-
22
-
23
-
24
-
25
-
26
-
27
-
28
-
29
-
30
-
31
-
32
-
33
-
34
-
35
-
36
-
37
-
38
-
39
-
40
-
41
-
42
-
43
-
44
-
45
-
46
-
47
-
48
-
49
-
50
-
51
-
52
-
53
-
54
-
55
-
56
-
57
-
58
-
59
-
60
-
61
-
62
-
63
-
64
-
65
-
66
-
67
-
68
-
69
-
70
-
71
-
72
-
73
-
74
-
75
-
76
-
77
-
78
-
79
-
80
-
81
-
82
-
83
-
84
-
85
-
86
-
87
-
88
-
89
-
90
-
91
-
92
-
93
-
94
-
95
-
96
-
97
-
98
-
99
-
100
-
101
-
102
-
103
-
104
-
105
-
106
-
107
-
108
-
109
-
110
-
111
-
112
-
113
-
114
-
115
-
116
-
117
-
118
-
119
-
120
-
121
-
122
-
123
-
124
-
125
-
126
-
127
-
128
-
129
-
130
-
131
-
132
-
133
-
134
-
135
-
136
-
137
-
138
-
139
-
140
-
141
-
142
-
143
-
144
-
145
-
146
-
147
-
148
-
149
-
150
-
151
-
152
-
153
-
154
-
155
-
156
-
157
-
158
-
159
-
160
-
 161
161 -
 162
162 -
 163
163 -
 164
164 -
 165
165 -
 166
166 -
 167
167 -
 168
168 -
 169
169 -
 170
170 -
 171
171 -
 172
172 -
 173
173 -
 174
174 -
 175
175 -
 176
176 -
 177
177 -
 178
178 -
 179
179 -
 180
180
 |
 |

2011/12 Annual Report Lenovo Group Limited 169
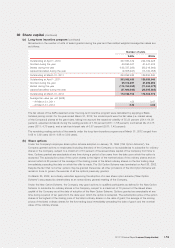
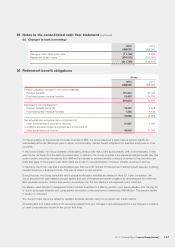
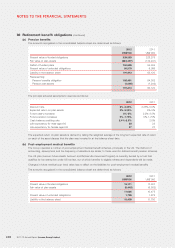
36 Retirement benefit obligations (continued)
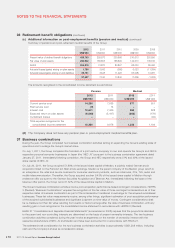
(c) Additional information on post-employment benefits (pension and medical)
Plan assets of the Group comprise:
Pension Medical
2012 2011 2012 2011
US$’000 US$’000 US$’000 US$’000
Equities 3,256 12,613 ––
Bonds 83,503 81,661 ––
Others 137,738 79,967 6,445 6,562
Total 224,497 174,241 6,445 6,562
Reconciliation of fair value of plan assets of the Group:
Pension Medical
2012 2011 2012 2011
US$’000 US$’000 US$’000 US$’000
Opening fair value 174,241 151,081 6,562 7,618
Exchange adjustment (2,846) 4,491 169 (810)
Expected return on plan assets 6,548 5,197 202 179
Actuarial losses (1,622) (3,511) (164) (131)
Contributions by the employer 28,093 23,367 44 30
Contributions by plan participants 191 165 ––
Benefits paid (5,226) (6,549) (368) (324)
Acquisition of subsidiaries 25,118 –––
Closing fair value 224,497 174,241 6,445 6,562
Actual return on plan assets 26,471 1,686 (120) 48
Contributions of US$17,599,000 are estimated to be made for the year ending March 31, 2013, excluding amounts due
to be transferred from IBM plans.
Reconciliation of movements in present value of defined benefit obligations of the Group:
Pension Medical
2012 2011 2012 2011
US$’000 US$’000 US$’000 US$’000
Opening defined benefit obligation 237,361 221,316 18,312 18,250
Exchange adjustment (3,236) 3,918 57 (766)
Current service cost 14,296 7,655 577 551
Past service cost (9) 14 ––
Interest cost 10,611 7,406 958 828
Actuarial losses/(gains) 35,385 3,681 366 (133)
Contributions by plan participants 191 165 ––
Benefits paid (5,665) (6,794) (420) (324)
Curtailments –––(94)
Acquisition of subsidiaries 126,976 –––
Closing defined benefit obligation 415,910 237,361 19,850 18,312
During the year, benefits of US$439,000 were paid directly by the Group (2011: US$245,000).