Lenovo 2012 Annual Report Download - page 127
Download and view the complete annual report
Please find page 127 of the 2012 Lenovo annual report below. You can navigate through the pages in the report by either clicking on the pages listed below, or by using the keyword search tool below to find specific information within the annual report.-
 1
1 -
2
-
3
-
4
-
5
-
6
-
7
-
8
-
9
-
10
-
11
-
12
-
13
-
14
-
15
-
16
-
17
-
18
-
19
-
20
-
21
-
22
-
23
-
24
-
25
-
26
-
27
-
28
-
29
-
30
-
31
-
32
-
33
-
34
-
35
-
36
-
37
-
38
-
39
-
40
-
41
-
42
-
43
-
44
-
45
-
46
-
47
-
48
-
49
-
50
-
51
-
52
-
53
-
54
-
55
-
56
-
57
-
58
-
59
-
60
-
61
-
62
-
63
-
64
-
65
-
66
-
67
-
68
-
69
-
70
-
71
-
72
-
73
-
74
-
75
-
76
-
77
-
78
-
79
-
80
-
81
-
82
-
83
-
84
-
85
-
86
-
87
-
88
-
89
-
90
-
91
-
92
-
93
-
94
-
95
-
96
-
97
-
98
-
99
-
100
-
101
-
102
-
103
-
104
-
105
-
106
-
107
-
108
-
109
-
110
-
111
-
112
-
113
-
114
-
115
-
116
-
 117
117 -
 118
118 -
 119
119 -
 120
120 -
 121
121 -
 122
122 -
 123
123 -
 124
124 -
 125
125 -
 126
126 -
 127
127 -
 128
128 -
 129
129 -
 130
130 -
 131
131 -
 132
132 -
 133
133 -
 134
134 -
 135
135 -
 136
136 -
 137
137 -
138
-
139
-
140
-
141
-
142
-
143
-
144
-
145
-
146
-
147
-
148
-
149
-
150
-
151
-
152
-
153
-
154
-
155
-
156
-
157
-
158
-
159
-
160
-
161
-
162
-
163
-
164
-
165
-
166
-
167
-
168
-
169
-
170
-
171
-
172
-
173
-
174
-
175
-
176
-
177
-
178
-
179
-
180
 |
 |

2011/12 Annual Report Lenovo Group Limited 125
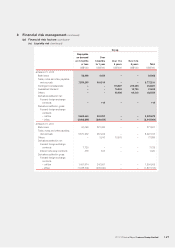
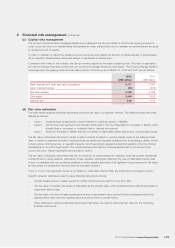
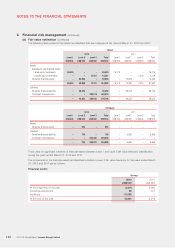
3 Financial risk management (continued)
(a) Financial risk factors (continued)
(i) Foreign currency risk (continued)
Group
2012 2011
United
States dollar Renminbi Euro
United
States dollar Renminbi Euro
US$’000 US$’000 US$’000 US$’000 US$’000 US$’000
Trade and other receivables 326,440 960 53,210 93,672 307 39,610
Bank deposits and cash
and cash equivalents 82,712 34,754 22,692 47,339 15,174 7,740
Trade and other payables (627,547) (6,487) (32,763) (97,133) (6,183) (17,470)
Intercompany balances
before elimination (1,971,439) 6,969 (80,501) (1,609,712) (164,367) 35,765
Gross exposure (2,189,834) 36,196 (37,362) (1,565,834) (155,069) 65,645
Notional amounts of forward
exchange contracts used as
economic hedges 2,032,745 –13,203 1,440,813 –(127,764)
Net exposure (157,089) 36,196 (24,159) (125,021) (155,069) (62,119)
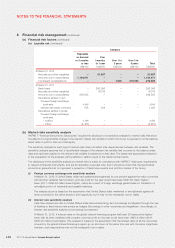
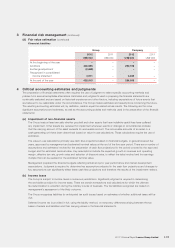
Company
2012 2011
United
States dollar Renminbi Euro
United
States dollar Renminbi Euro
US$’000 US$’000 US$’000 US$’000 US$’000 US$’000
Other receivables – 2 1 – – 53
Bank deposits and cash
and cash equivalents – – 43 – – 46
Other payables – – (63) – – (105)
Amounts due from subsidiaries –190 ––101 –
Amounts due to subsidiaries –(137) (171) –(132) (182)
Net exposure –55 (190) –(31) (188)