Lenovo 2012 Annual Report Download - page 163
Download and view the complete annual report
Please find page 163 of the 2012 Lenovo annual report below. You can navigate through the pages in the report by either clicking on the pages listed below, or by using the keyword search tool below to find specific information within the annual report.-
 1
1 -
2
-
3
-
4
-
5
-
6
-
7
-
8
-
9
-
10
-
11
-
12
-
13
-
14
-
15
-
16
-
17
-
18
-
19
-
20
-
21
-
22
-
23
-
24
-
25
-
26
-
27
-
28
-
29
-
30
-
31
-
32
-
33
-
34
-
35
-
36
-
37
-
38
-
39
-
40
-
41
-
42
-
43
-
44
-
45
-
46
-
47
-
48
-
49
-
50
-
51
-
52
-
53
-
54
-
55
-
56
-
57
-
58
-
59
-
60
-
61
-
62
-
63
-
64
-
65
-
66
-
67
-
68
-
69
-
70
-
71
-
72
-
73
-
74
-
75
-
76
-
77
-
78
-
79
-
80
-
81
-
82
-
83
-
84
-
85
-
86
-
87
-
88
-
89
-
90
-
91
-
92
-
93
-
94
-
95
-
96
-
97
-
98
-
99
-
100
-
101
-
102
-
103
-
104
-
105
-
106
-
107
-
108
-
109
-
110
-
111
-
112
-
113
-
114
-
115
-
116
-
117
-
118
-
119
-
120
-
121
-
122
-
123
-
124
-
125
-
126
-
127
-
128
-
129
-
130
-
131
-
132
-
133
-
134
-
135
-
136
-
137
-
138
-
139
-
140
-
141
-
142
-
143
-
144
-
145
-
146
-
147
-
148
-
149
-
150
-
151
-
152
-
 153
153 -
 154
154 -
 155
155 -
 156
156 -
 157
157 -
 158
158 -
 159
159 -
 160
160 -
 161
161 -
 162
162 -
 163
163 -
 164
164 -
 165
165 -
 166
166 -
 167
167 -
 168
168 -
 169
169 -
 170
170 -
 171
171 -
 172
172 -
 173
173 -
174
-
175
-
176
-
177
-
178
-
179
-
180
 |
 |

2011/12 Annual Report Lenovo Group Limited 161
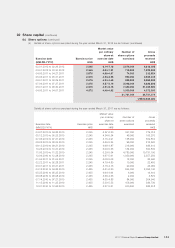
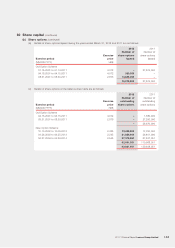
30 Share capital (continued)
(b) Share options (continued)
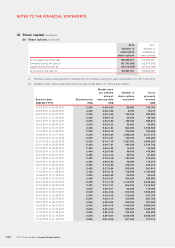
(ii) Details of share options exercised during the year ended March 31, 2012 are as follows: (continued)
Exercise date Exercise price
Market value
per ordinary
share at
exercise date
Number of
share options
exercised
Gross
proceeds
received
(MM.DD.YYYY) HK$ HK$ HK$
02.01.2012 to 02.29.2012 2.545 6.14-7.18 2,679,000 6,818,055
03.01.2012 to 03.30.2012 2.545 6.64-7.31 716,000 1,822,220
04.06.2011 to 04.27.2011 2.876 4.39-4.57 74,000 212,824
05.03.2011 to 05.31.2011 2.876 4.23-4.58 932,000 2,680,432
06.01.2011 to 06.29.2011 2.876 4.24-4.43 820,000 2,358,320
07.04.2011 to 07.27.2011 2.876 4.57-5.19 3,208,000 9,226,208
08.01.2011 to 08.30.2011 2.876 4.51-5.15 7,420,000 21,339,920
04.06.2011 to 04.07.2011 4.072 4.49-4.52 1,000,000 4,072,000
31,761,000 84,721,079
US$10,889,000
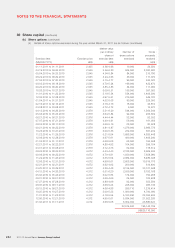
Details of share options exercised during the year ended March 31, 2011 are as follows:
Exercise date Exercise price
Market value
per ordinary
share at
exercise date
Number of
share options
exercised
Gross
proceeds
received
(MM.DD.YYYY) HK$ HK$ HK$
04.07.2010 to 04.26.2010 2.245 5.67-6.20 347,000 779,015
05.12.2010 to 05.25.2010 2.245 4.64-5.34 46,000 103,270
07.05.2010 to 07.21.2010 2.245 4.15-4.91 138,000 309,810
08.03.2010 to 08.24.2010 2.245 4.56-5.24 96,000 215,520
09.13.2010 to 09.21.2010 2.245 4.66-4.87 218,000 489,410
10.25.2010 to 10.27.2010 2.245 5.09-5.33 134,000 300,830
11.03.2010 to 11.22.2010 2.245 5.20-5.54 4,780,000 10,731,100
12.06.2010 to 12.28.2010 2.245 4.97-5.61 1,050,000 2,357,250
01.04.2011 to 01.04.2011 2.245 5.08-5.08 12,000 26,940
02.22.2011 to 02.28.2011 2.245 4.70-4.80 10,000 22,450
03.01.2011 to 03.21.2011 2.245 4.18-4.75 20,000 44,900
04.13.2010 to 04.26.2010 2.435 5.51-6.20 844,000 2,055,140
05.25.2010 to 05.25.2010 2.435 4.64-4.64 6,000 14,610
06.08.2010 to 06.08.2010 2.435 4.36-4.36 2,000 4,870
07.14.2010 to 07.27.2010 2.435 4.55-4.88 84,000 204,540
11.15.2010 to 11.25.2010 2.435 5.30-5.53 158,000 384,730
12.01.2010 to 12.06.2010 2.435 5.27-5.61 240,500 585,618