Lenovo 2012 Annual Report Download - page 157
Download and view the complete annual report
Please find page 157 of the 2012 Lenovo annual report below. You can navigate through the pages in the report by either clicking on the pages listed below, or by using the keyword search tool below to find specific information within the annual report.-
 1
1 -
2
-
3
-
4
-
5
-
6
-
7
-
8
-
9
-
10
-
11
-
12
-
13
-
14
-
15
-
16
-
17
-
18
-
19
-
20
-
21
-
22
-
23
-
24
-
25
-
26
-
27
-
28
-
29
-
30
-
31
-
32
-
33
-
34
-
35
-
36
-
37
-
38
-
39
-
40
-
41
-
42
-
43
-
44
-
45
-
46
-
47
-
48
-
49
-
50
-
51
-
52
-
53
-
54
-
55
-
56
-
57
-
58
-
59
-
60
-
61
-
62
-
63
-
64
-
65
-
66
-
67
-
68
-
69
-
70
-
71
-
72
-
73
-
74
-
75
-
76
-
77
-
78
-
79
-
80
-
81
-
82
-
83
-
84
-
85
-
86
-
87
-
88
-
89
-
90
-
91
-
92
-
93
-
94
-
95
-
96
-
97
-
98
-
99
-
100
-
101
-
102
-
103
-
104
-
105
-
106
-
107
-
108
-
109
-
110
-
111
-
112
-
113
-
114
-
115
-
116
-
117
-
118
-
119
-
120
-
121
-
122
-
123
-
124
-
125
-
126
-
127
-
128
-
129
-
130
-
131
-
132
-
133
-
134
-
135
-
136
-
137
-
138
-
139
-
140
-
141
-
142
-
143
-
144
-
145
-
146
-
 147
147 -
 148
148 -
 149
149 -
 150
150 -
 151
151 -
 152
152 -
 153
153 -
 154
154 -
 155
155 -
 156
156 -
 157
157 -
 158
158 -
 159
159 -
 160
160 -
 161
161 -
 162
162 -
 163
163 -
 164
164 -
 165
165 -
 166
166 -
 167
167 -
168
-
169
-
170
-
171
-
172
-
173
-
174
-
175
-
176
-
177
-
178
-
179
-
180
 |
 |
2011/12 Annual Report Lenovo Group Limited 155
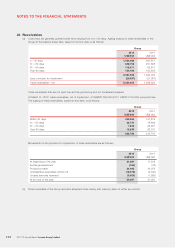
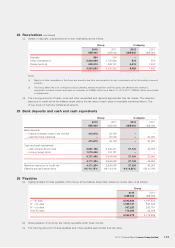
24 Receivables (continued)
(c) Details of deposits, prepayments and other receivables are as follows:
Group Company
2012 2011 2012 2011
US$’000 US$’000 US$’000 US$’000
Deposits 884 504 ––
Other receivables (i) 2,442,656 1,765,680 513 379
Prepayments (ii) 859,513 539,141 5,415 1,247
3,303,053 2,305,325 5,928 1,626
Notes:
(i) Majority of other receivables of the Group are amounts due from subcontractors for part components sold in the ordinary course of
business.
(ii) The Group defers the cost of shipped products awaiting revenue recognition until the goods are delivered and revenue is
recognized. In-transit product shipments to customers of US$392 million as at March 31, 2012 (2011: US$236 million) are included
in prepayments.
(d) The carrying amounts of trade, notes and other receivables and deposits approximate their fair values. The maximum
exposure to credit risk at the balance sheet date is the fair value of each class of receivable mentioned above. The
Group does not hold any collateral as security.
25 Bank deposits and cash and cash equivalents
Group Company
2012 2011 2012 2011
US$’000 US$’000 US$’000 US$’000
Bank deposits
– matured between three to six months 413,672 22,158 ––
– restricted bank balances –20,000 –20,000
413,672 42,158 –20,000
Cash and cash equivalents
– cash at bank and in hand 2,681,196 2,222,317 37,124 25,955
– money market funds 1,076,456 732,181 ––
3,757,652 2,954,498 37,124 25,955
4,171,324 2,996,656 37,124 45,955
Maximum exposure to credit risk 4,171,324 2,996,656 37,124 45,955
Effective annual interest rates 0%-10.78% 0%-12.01% 0%-0.25% 0%-0.21%
26 Payables
(a) Ageing analysis of trade payables of the Group at the balance sheet date, based on invoice date, is as follows:
Group
2012 2011
US$’000 US$’000
0 – 30 days 2,543,626 1,381,832
31 – 60 days 1,025,131 503,648
61 – 90 days 307,223 230,791
Over 90 days 174,292 63,568
4,050,272 2,179,839
(b) Notes payable of the Group are mainly repayable within three months.
(c) The carrying amounts of trade payables and notes payable approximate their fair value.