Lenovo 2012 Annual Report Download - page 158
Download and view the complete annual report
Please find page 158 of the 2012 Lenovo annual report below. You can navigate through the pages in the report by either clicking on the pages listed below, or by using the keyword search tool below to find specific information within the annual report.-
 1
1 -
2
-
3
-
4
-
5
-
6
-
7
-
8
-
9
-
10
-
11
-
12
-
13
-
14
-
15
-
16
-
17
-
18
-
19
-
20
-
21
-
22
-
23
-
24
-
25
-
26
-
27
-
28
-
29
-
30
-
31
-
32
-
33
-
34
-
35
-
36
-
37
-
38
-
39
-
40
-
41
-
42
-
43
-
44
-
45
-
46
-
47
-
48
-
49
-
50
-
51
-
52
-
53
-
54
-
55
-
56
-
57
-
58
-
59
-
60
-
61
-
62
-
63
-
64
-
65
-
66
-
67
-
68
-
69
-
70
-
71
-
72
-
73
-
74
-
75
-
76
-
77
-
78
-
79
-
80
-
81
-
82
-
83
-
84
-
85
-
86
-
87
-
88
-
89
-
90
-
91
-
92
-
93
-
94
-
95
-
96
-
97
-
98
-
99
-
100
-
101
-
102
-
103
-
104
-
105
-
106
-
107
-
108
-
109
-
110
-
111
-
112
-
113
-
114
-
115
-
116
-
117
-
118
-
119
-
120
-
121
-
122
-
123
-
124
-
125
-
126
-
127
-
128
-
129
-
130
-
131
-
132
-
133
-
134
-
135
-
136
-
137
-
138
-
139
-
140
-
141
-
142
-
143
-
144
-
145
-
146
-
147
-
 148
148 -
 149
149 -
 150
150 -
 151
151 -
 152
152 -
 153
153 -
 154
154 -
 155
155 -
 156
156 -
 157
157 -
 158
158 -
 159
159 -
 160
160 -
 161
161 -
 162
162 -
 163
163 -
 164
164 -
 165
165 -
 166
166 -
 167
167 -
 168
168 -
169
-
170
-
171
-
172
-
173
-
174
-
175
-
176
-
177
-
178
-
179
-
180
 |
 |

2011/12 Annual Report Lenovo Group Limited
156
NOTES TO THE FINANCIAL STATEMENTS
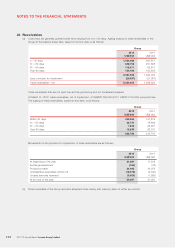
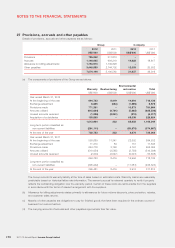
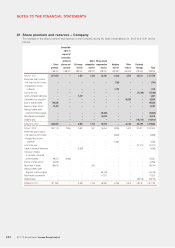
27 Provisions, accruals and other payables
Details of provisions, accruals and other payables are as follows:
Group Company
2012 2011 2012 2011
US$’000 US$’000 US$’000 US$’000
Provisions 725,062 311,813 ––
Accruals 1,146,665 904,219 19,628 18,817
Allowance for billing adjustments 1,753,910 1,139,828 ––
Other payables 3,448,559 2,744,702 12,009 20,502
7,074,196 5,100,562 31,637 39,319
(a) The components of provisions of the Group are as follows:
Warranty Restructuring
Environmental
restoration Total
US$’000 US$’000 US$’000 US$’000
Year ended March 31, 2012
At the beginning of the year 694,723 8,419 14,994 718,136
Exchange adjustment 8,835 (564) (1,699) 6,572
Provisions made 771,391 –10,573 781,964
Amounts utilized (615,684) (4,761) (5,085) (625,530)
Unused amounts reversed (1,286) (2,861) (870) (5,017)
Acquisition of subsidiaries 155,885 –68,039 223,924
1,013,864 233 85,952 1,100,049
Long-term portion classified as
non-current liabilities (291,111) –(83,876) (374,987)
At the end of the year 722,753 233 2,076 725,062
Year ended March 31, 2011
At the beginning of the year 550,689 11,341 22,502 584,532
Exchange adjustment 11,310 84 151 11,545
Provisions made 644,778 3,126 4,191 652,095
Amounts utilized (510,054) (3,585) (2,759) (516,398)
Unused amounts reversed (2,000) (2,547) (9,091) (13,638)
694,723 8,419 14,994 718,136
Long-term portion classified as
non-current liabilities (395,242) –(11,081) (406,323)
At the end of the year 299,481 8,419 3,913 311,813
The Group records its warranty liability at the time of sales based on estimated costs. Warranty claims are reasonably
predictable based on historical failure rate information. The warranty accrual is reviewed quarterly to verify it properly
reflects the outstanding obligation over the warranty period. Certain of these costs are reimbursable from the suppliers
in accordance with the terms of relevant arrangement with the suppliers.
(b) Allowance for billing adjustments relates primarily to allowances for future volume discounts, price protection, rebates,
and customer sales returns.
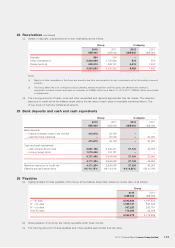
(c) Majority of other payables are obligations to pay for finished goods that have been acquired in the ordinary course of
business from subcontractors.
(d) The carrying amounts of accruals and other payables approximate their fair value.