Lenovo 2012 Annual Report Download - page 108
Download and view the complete annual report
Please find page 108 of the 2012 Lenovo annual report below. You can navigate through the pages in the report by either clicking on the pages listed below, or by using the keyword search tool below to find specific information within the annual report.-
 1
1 -
2
-
3
-
4
-
5
-
6
-
7
-
8
-
9
-
10
-
11
-
12
-
13
-
14
-
15
-
16
-
17
-
18
-
19
-
20
-
21
-
22
-
23
-
24
-
25
-
26
-
27
-
28
-
29
-
30
-
31
-
32
-
33
-
34
-
35
-
36
-
37
-
38
-
39
-
40
-
41
-
42
-
43
-
44
-
45
-
46
-
47
-
48
-
49
-
50
-
51
-
52
-
53
-
54
-
55
-
56
-
57
-
58
-
59
-
60
-
61
-
62
-
63
-
64
-
65
-
66
-
67
-
68
-
69
-
70
-
71
-
72
-
73
-
74
-
75
-
76
-
77
-
78
-
79
-
80
-
81
-
82
-
83
-
84
-
85
-
86
-
87
-
88
-
89
-
90
-
91
-
92
-
93
-
94
-
95
-
96
-
97
-
 98
98 -
 99
99 -
 100
100 -
 101
101 -
 102
102 -
 103
103 -
 104
104 -
 105
105 -
 106
106 -
 107
107 -
 108
108 -
 109
109 -
 110
110 -
 111
111 -
 112
112 -
 113
113 -
 114
114 -
 115
115 -
 116
116 -
 117
117 -
 118
118 -
119
-
120
-
121
-
122
-
123
-
124
-
125
-
126
-
127
-
128
-
129
-
130
-
131
-
132
-
133
-
134
-
135
-
136
-
137
-
138
-
139
-
140
-
141
-
142
-
143
-
144
-
145
-
146
-
147
-
148
-
149
-
150
-
151
-
152
-
153
-
154
-
155
-
156
-
157
-
158
-
159
-
160
-
161
-
162
-
163
-
164
-
165
-
166
-
167
-
168
-
169
-
170
-
171
-
172
-
173
-
174
-
175
-
176
-
177
-
178
-
179
-
180
 |
 |

2011/12 Annual Report Lenovo Group Limited
106
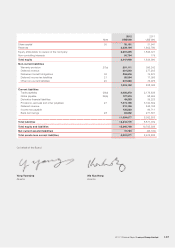
CONSOLIDATED BALANCE SHEET
At March 31, 2012
2012 2011
Note US$’000 US$’000
Non-current assets
Property, plant and equipment 14 392,474 209,417
Prepaid lease payments 15 13,552 9,682
Construction-in-progress 16 103,986 32,092
Intangible assets 17 3,091,205 2,134,452
Interests in associates and jointly controlled entities 19 3,410 914
Deferred income tax assets 21 332,493 251,098
Available-for-sale financial assets 22 71,946 78,689
Other non-current assets 31,282 53,132
4,040,348 2,769,476
Current assets
Inventories 23 1,218,494 803,702
Trade receivables 24(a) 2,354,909 1,368,924
Notes receivable 24(b) 639,331 391,649
Derivative financial assets 62,883 13,295
Deposits, prepayments and other receivables 24(c) 3,303,053 2,305,325
Income tax recoverable 70,406 56,912
Bank deposits 25 413,672 42,158
Cash and cash equivalents 25 3,757,652 2,954,498
11,820,400 7,936,463
Total assets 15,860,748 10,705,939