Lenovo 2012 Annual Report Download - page 155
Download and view the complete annual report
Please find page 155 of the 2012 Lenovo annual report below. You can navigate through the pages in the report by either clicking on the pages listed below, or by using the keyword search tool below to find specific information within the annual report.-
 1
1 -
2
-
3
-
4
-
5
-
6
-
7
-
8
-
9
-
10
-
11
-
12
-
13
-
14
-
15
-
16
-
17
-
18
-
19
-
20
-
21
-
22
-
23
-
24
-
25
-
26
-
27
-
28
-
29
-
30
-
31
-
32
-
33
-
34
-
35
-
36
-
37
-
38
-
39
-
40
-
41
-
42
-
43
-
44
-
45
-
46
-
47
-
48
-
49
-
50
-
51
-
52
-
53
-
54
-
55
-
56
-
57
-
58
-
59
-
60
-
61
-
62
-
63
-
64
-
65
-
66
-
67
-
68
-
69
-
70
-
71
-
72
-
73
-
74
-
75
-
76
-
77
-
78
-
79
-
80
-
81
-
82
-
83
-
84
-
85
-
86
-
87
-
88
-
89
-
90
-
91
-
92
-
93
-
94
-
95
-
96
-
97
-
98
-
99
-
100
-
101
-
102
-
103
-
104
-
105
-
106
-
107
-
108
-
109
-
110
-
111
-
112
-
113
-
114
-
115
-
116
-
117
-
118
-
119
-
120
-
121
-
122
-
123
-
124
-
125
-
126
-
127
-
128
-
129
-
130
-
131
-
132
-
133
-
134
-
135
-
136
-
137
-
138
-
139
-
140
-
141
-
142
-
143
-
144
-
 145
145 -
 146
146 -
 147
147 -
 148
148 -
 149
149 -
 150
150 -
 151
151 -
 152
152 -
 153
153 -
 154
154 -
 155
155 -
 156
156 -
 157
157 -
 158
158 -
 159
159 -
 160
160 -
 161
161 -
 162
162 -
 163
163 -
 164
164 -
 165
165 -
166
-
167
-
168
-
169
-
170
-
171
-
172
-
173
-
174
-
175
-
176
-
177
-
178
-
179
-
180
 |
 |

2011/12 Annual Report Lenovo Group Limited 153
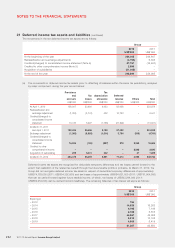
21 Deferred income tax assets and liabilities (continued)
(b) The movements in deferred income tax liabilities (prior to offsetting of balances within the same tax jurisdiction),
analyzed by major component, during the year are as follows:
Intangible
valuation
Undistributed
earnings
Property
valuation
Accelerated
tax
depreciation Total
US$’000 US$’000 US$’000 US$’000 US$’000
At April 1, 2010 –10,331 – – 10,331
Exchange adjustment –128 – 8 136
Charged to consolidated income statement –6,151 –475 6,626
At March 31, 2011 and April 1, 2011 –16,610 –483 17,093
Exchange adjustment –(23) –15 (8)
(Credited)/charged to consolidated
income statement (1,219) 10,681 (483) (271) 8,708
Acquisition of subsidiaries 53,190 –4,884 –58,074
At March 31, 2012 51,971 27,268 4,401 227 83,867
22 Available-for-sale financial assets
Group
2012 2011
US$’000 US$’000
At the beginning of the year 78,689 112,520
Exchange adjustment (120) 81
Fair value change recognized in other comprehensive income (36,337) (15,892)
Additions 10,055 –
Disposals –(18,020)
Acquisition of subsidiaries 19,659 –
At the end of the year 71,946 78,689
Equity securities, at fair value
Listed in Hong Kong 512 1,442
Listed outside Hong Kong 59,113 75,031
Unlisted 12,321 2,216
71,946 78,689
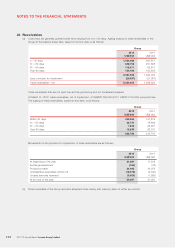
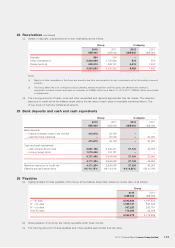
23 Inventories
Group
2012 2011
US$’000 US$’000
Raw materials and work-in-progress 484,314 293,660
Finished goods 613,962 411,810
Service parts 120,218 98,232
1,218,494 803,702