Lenovo 2012 Annual Report Download - page 137
Download and view the complete annual report
Please find page 137 of the 2012 Lenovo annual report below. You can navigate through the pages in the report by either clicking on the pages listed below, or by using the keyword search tool below to find specific information within the annual report.-
 1
1 -
2
-
3
-
4
-
5
-
6
-
7
-
8
-
9
-
10
-
11
-
12
-
13
-
14
-
15
-
16
-
17
-
18
-
19
-
20
-
21
-
22
-
23
-
24
-
25
-
26
-
27
-
28
-
29
-
30
-
31
-
32
-
33
-
34
-
35
-
36
-
37
-
38
-
39
-
40
-
41
-
42
-
43
-
44
-
45
-
46
-
47
-
48
-
49
-
50
-
51
-
52
-
53
-
54
-
55
-
56
-
57
-
58
-
59
-
60
-
61
-
62
-
63
-
64
-
65
-
66
-
67
-
68
-
69
-
70
-
71
-
72
-
73
-
74
-
75
-
76
-
77
-
78
-
79
-
80
-
81
-
82
-
83
-
84
-
85
-
86
-
87
-
88
-
89
-
90
-
91
-
92
-
93
-
94
-
95
-
96
-
97
-
98
-
99
-
100
-
101
-
102
-
103
-
104
-
105
-
106
-
107
-
108
-
109
-
110
-
111
-
112
-
113
-
114
-
115
-
116
-
117
-
118
-
119
-
120
-
121
-
122
-
123
-
124
-
125
-
126
-
 127
127 -
 128
128 -
 129
129 -
 130
130 -
 131
131 -
 132
132 -
 133
133 -
 134
134 -
 135
135 -
 136
136 -
 137
137 -
 138
138 -
 139
139 -
 140
140 -
 141
141 -
 142
142 -
 143
143 -
 144
144 -
 145
145 -
 146
146 -
 147
147 -
148
-
149
-
150
-
151
-
152
-
153
-
154
-
155
-
156
-
157
-
158
-
159
-
160
-
161
-
162
-
163
-
164
-
165
-
166
-
167
-
168
-
169
-
170
-
171
-
172
-
173
-
174
-
175
-
176
-
177
-
178
-
179
-
180
 |
 |

2011/12 Annual Report Lenovo Group Limited 135
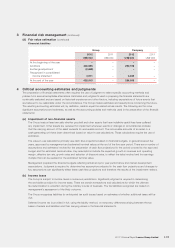
5 Segment information (continued)
(c) Segment liabilities for reportable segments
2012 2011
US$’000 US$’000
China 3,171,430 1,833,711
Emerging markets (excluding China) 456,608 366,575
Mature markets 3,808,911 1,563,680
Segment liabilities for reportable segments 7,436,949 3,763,966
Unallocated:
Income tax payable 135,530 96,711
Deferred income tax liabilities 83,594 17,093
Derivative financial liabilities 49,253 39,223
Unallocated bank borrowings –200,000
Unallocated trade payables 2,588,379 1,771,633
Unallocated provisions, accruals and other payables 3,076,210 2,942,621
Other unallocated liabilities 42,864 39,792
Total liabilities per consolidated balance sheet 13,412,779 8,871,039
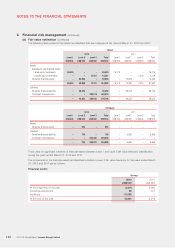
(d) Analysis of revenue by significant category
Revenue from external customers are mainly derived from the sale of personal computer products and services.
Breakdown of revenue is as follows:
2012 2011
US$’000 US$’000
Sale of personal technology products and services
– desktop computer 9,883,538 7,307,142
– notebook computer 16,696,527 12,990,444
– mobile internet and digital home 1,484,395 804,459
– others 611,466 492,326
Sale of other goods and services 898,512 –
29,574,438 21,594,371
(e) Other segment information
China
Emerging markets
(excluding China) Mature markets Total
2012 2011 2012 2011 2012 2011 2012 2011
US$’000 US$’000 US$’000 US$’000 US$’000 US$’000 US$’000 US$’000
Depreciation and amortization 72,912 71,380 28,151 22,017 74,342 82,743 175,405 176,140
Finance income 2,988 2,126 4,449 3,574 3,631 584 11,068 6,284
Finance costs –250 4,306 3,423 20,920 14,900 25,226 18,573
Additions to non-current assets* 86,071 46,256 11,474 6,305 27,591 15,510 125,136 68,071
* Other than financial instruments and deferred income tax assets; and exclude construction-in-progress pending allocation to
segments.
The total of non-current assets other than financial instruments, deferred income tax assets and post-employment benefit
assets (there are no rights arising under insurance contracts) located in China and other countries are approximately
US$1,801,595,000 (2011: US$1,592,475,000) and US$1,834,314,000 (2011: US$847,214,000) respectively.