Lenovo 2012 Annual Report Download - page 152
Download and view the complete annual report
Please find page 152 of the 2012 Lenovo annual report below. You can navigate through the pages in the report by either clicking on the pages listed below, or by using the keyword search tool below to find specific information within the annual report.-
 1
1 -
2
-
3
-
4
-
5
-
6
-
7
-
8
-
9
-
10
-
11
-
12
-
13
-
14
-
15
-
16
-
17
-
18
-
19
-
20
-
21
-
22
-
23
-
24
-
25
-
26
-
27
-
28
-
29
-
30
-
31
-
32
-
33
-
34
-
35
-
36
-
37
-
38
-
39
-
40
-
41
-
42
-
43
-
44
-
45
-
46
-
47
-
48
-
49
-
50
-
51
-
52
-
53
-
54
-
55
-
56
-
57
-
58
-
59
-
60
-
61
-
62
-
63
-
64
-
65
-
66
-
67
-
68
-
69
-
70
-
71
-
72
-
73
-
74
-
75
-
76
-
77
-
78
-
79
-
80
-
81
-
82
-
83
-
84
-
85
-
86
-
87
-
88
-
89
-
90
-
91
-
92
-
93
-
94
-
95
-
96
-
97
-
98
-
99
-
100
-
101
-
102
-
103
-
104
-
105
-
106
-
107
-
108
-
109
-
110
-
111
-
112
-
113
-
114
-
115
-
116
-
117
-
118
-
119
-
120
-
121
-
122
-
123
-
124
-
125
-
126
-
127
-
128
-
129
-
130
-
131
-
132
-
133
-
134
-
135
-
136
-
137
-
138
-
139
-
140
-
141
-
 142
142 -
 143
143 -
 144
144 -
 145
145 -
 146
146 -
 147
147 -
 148
148 -
 149
149 -
 150
150 -
 151
151 -
 152
152 -
 153
153 -
 154
154 -
 155
155 -
 156
156 -
 157
157 -
 158
158 -
 159
159 -
 160
160 -
 161
161 -
 162
162 -
163
-
164
-
165
-
166
-
167
-
168
-
169
-
170
-
171
-
172
-
173
-
174
-
175
-
176
-
177
-
178
-
179
-
180
 |
 |

2011/12 Annual Report Lenovo Group Limited
150
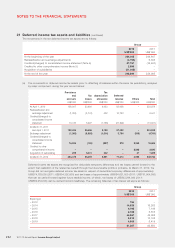
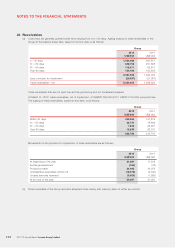
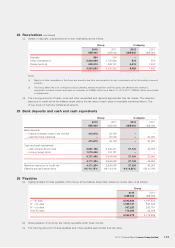
NOTES TO THE FINANCIAL STATEMENTS
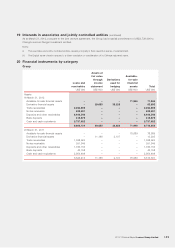
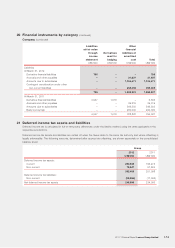
20 Financial instruments by category (continued)
Group (continued)
Liabilities
at fair value
through
income
statement
Derivatives
used for
hedging
Other
financial
liabilities at
amortized
cost Total
US$’000 US$’000 US$’000 US$’000
Liabilities
At March 31, 2012
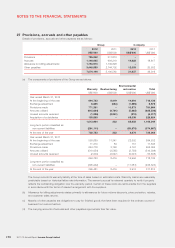
Trade payables – – 4,050,272 4,050,272
Notes payable – – 127,315 127,315
Derivative financial liabilities 35,337 13,916 –49,253
Accruals and other payables – – 4,595,224 4,595,224
Bank borrowings – – 62,952 62,952
Contingent consideration under other
non-current liabilities – – 428,915 428,915
35,337 13,916 9,264,678 9,313,931
At March 31, 2011
Trade payables – – 2,179,839 2,179,839
Notes payable – – 98,964 98,964
Derivative financial liabilities 20,110 19,113 –39,223
Accruals and other payables – – 3,648,921 3,648,921
Bank borrowings – – 271,561 271,561
20,110 19,113 6,199,285 6,238,508
Company
Loans and receivables
2012 2011
US$’000 US$’000
Assets
Deposits 499 379
Amounts due from subsidiaries 777,818 692,351
Cash and cash equivalents 37,124 25,955
815,441 718,685