Lenovo 2011 Annual Report Download - page 97
Download and view the complete annual report
Please find page 97 of the 2011 Lenovo annual report below. You can navigate through the pages in the report by either clicking on the pages listed below, or by using the keyword search tool below to find specific information within the annual report.-
 1
1 -
2
-
3
-
4
-
5
-
6
-
7
-
8
-
9
-
10
-
11
-
12
-
13
-
14
-
15
-
16
-
17
-
18
-
19
-
20
-
21
-
22
-
23
-
24
-
25
-
26
-
27
-
28
-
29
-
30
-
31
-
32
-
33
-
34
-
35
-
36
-
37
-
38
-
39
-
40
-
41
-
42
-
43
-
44
-
45
-
46
-
47
-
48
-
49
-
50
-
51
-
52
-
53
-
54
-
55
-
56
-
57
-
58
-
59
-
60
-
61
-
62
-
63
-
64
-
65
-
66
-
67
-
68
-
69
-
70
-
71
-
72
-
73
-
74
-
75
-
76
-
77
-
78
-
79
-
80
-
81
-
82
-
83
-
84
-
85
-
86
-
 87
87 -
 88
88 -
 89
89 -
 90
90 -
 91
91 -
 92
92 -
 93
93 -
 94
94 -
 95
95 -
 96
96 -
 97
97 -
 98
98 -
 99
99 -
 100
100 -
 101
101 -
 102
102 -
 103
103 -
 104
104 -
 105
105 -
 106
106 -
 107
107 -
108
-
109
-
110
-
111
-
112
-
113
-
114
-
115
-
116
-
117
-
118
-
119
-
120
-
121
-
122
-
123
-
124
-
125
-
126
-
127
-
128
-
129
-
130
-
131
-
132
-
133
-
134
-
135
-
136
-
137
 |
 |

2010/11 Annual Report Lenovo Group Limited
100
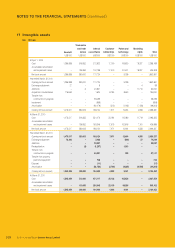
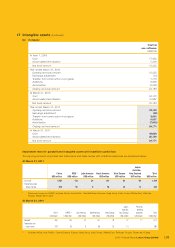
NOTES TO THE FINANCIAL STATEMENTS (continued)
5 Segment information (continued)
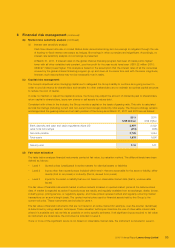
(d) Reconciliation of segment liabilities for reportable segments to total liabilities per consolidated balance sheet is provided
as follows:
2011 2010
US$’000 US$’000
Segment liabilities for reportable segments 7,391,031 5,378,407
Unallocated:
Income tax payable 96,711 84,329
Deferred income tax liabilities 17,093 10,331
Derivative financial liabilities 39,223 11,507
Unallocated bank borrowings 200,000 430,000
Convertible preferred shares –94,980
Other unallocated liabilities 1,126,981 1,340,356
Total liabilities per consolidated balance sheet 8,871,039 7,349,910
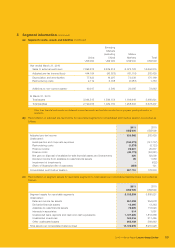
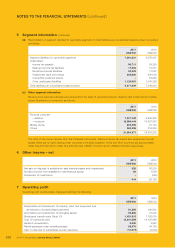
(e) Other segment information
Revenue from external customers are derived from the sales of personal computer (desktop and notebook) and mobile
phone. Breakdown of revenue is as follows:
2011 2010
US$’000 US$’000
Personal computer
– desktop 7,307,142 5,859,405
– notebook 12,990,444 10,437,927
Mobile phone 804,459 91,144
Others 492,326 216,339
21,594,371 16,604,815
The total of non-current assets other than financial instruments, deferred income tax assets and employment benefit
assets (there are no rights arising under insurance contracts) located in China and other countries are approximately
US$1,592,475,000 (2010: US$1,402,505,000) and US$847,214,000 (2010: US$950,312,000) respectively.
6 Other income – net
2011 2010
US$’000 US$’000
Net gain on disposal of available-for-sale financial assets and investments 326 82,090
Dividend income from available-for-sale financial assets 93 1,558
Impairment of investments –(522)
419 83,126
7 Operating profit
Operating profit is stated after charging/(crediting) the following:
2011 2010
US$’000 US$’000
Depreciation and impairment of property, plant and equipment and
amortization of prepaid lease payments 81,856 106,591
Amortization and impairment of intangible assets 94,284 70,202
Employees’ benefit costs (Note 10) 1,431,218 1,182,019
Cost of inventories sold 18,641,858 14,105,889
Auditor’s remuneration 3,940 3,640
Rental expenses under operating leases 52,670 44,729
Gain on disposal of subsidiaries and an associate (13,015) (2,600)