Lenovo 2011 Annual Report Download - page 93
Download and view the complete annual report
Please find page 93 of the 2011 Lenovo annual report below. You can navigate through the pages in the report by either clicking on the pages listed below, or by using the keyword search tool below to find specific information within the annual report.-
 1
1 -
2
-
3
-
4
-
5
-
6
-
7
-
8
-
9
-
10
-
11
-
12
-
13
-
14
-
15
-
16
-
17
-
18
-
19
-
20
-
21
-
22
-
23
-
24
-
25
-
26
-
27
-
28
-
29
-
30
-
31
-
32
-
33
-
34
-
35
-
36
-
37
-
38
-
39
-
40
-
41
-
42
-
43
-
44
-
45
-
46
-
47
-
48
-
49
-
50
-
51
-
52
-
53
-
54
-
55
-
56
-
57
-
58
-
59
-
60
-
61
-
62
-
63
-
64
-
65
-
66
-
67
-
68
-
69
-
70
-
71
-
72
-
73
-
74
-
75
-
76
-
77
-
78
-
79
-
80
-
81
-
82
-
 83
83 -
 84
84 -
 85
85 -
 86
86 -
 87
87 -
 88
88 -
 89
89 -
 90
90 -
 91
91 -
 92
92 -
 93
93 -
 94
94 -
 95
95 -
 96
96 -
 97
97 -
 98
98 -
 99
99 -
 100
100 -
 101
101 -
 102
102 -
 103
103 -
104
-
105
-
106
-
107
-
108
-
109
-
110
-
111
-
112
-
113
-
114
-
115
-
116
-
117
-
118
-
119
-
120
-
121
-
122
-
123
-
124
-
125
-
126
-
127
-
128
-
129
-
130
-
131
-
132
-
133
-
134
-
135
-
136
-
137
 |
 |

2010/11 Annual Report Lenovo Group Limited
96
NOTES TO THE FINANCIAL STATEMENTS (continued)
3 Financial risk management (continued)
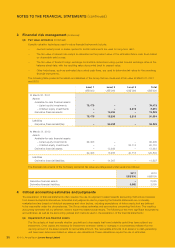
(d) Fair value estimation (continued)
Specific valuation techniques used to value financial instruments include:
–Quoted market prices or dealer quotes for similar instruments are used for long-term debt.
–The fair value of interest rate swaps is calculated as the present value of the estimated future cash flows based
on observable yield curves.
–The fair value of forward foreign exchange contracts is determined using quoted forward exchange rates at the
balance sheet date, with the resulting value discounted back to present value.
–Other techniques, such as estimated discounted cash flows, are used to determine fair value for the remaining
financial instruments.
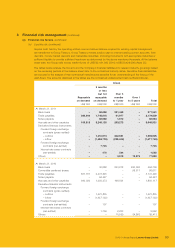
The following table presents the assets and liabilities of the Group that are measured at fair value at March 31, 2011
and 2010.
Level 1 Level 2 Level 3 Total
US$’000 US$’000 US$’000 US$’000
At March 31, 2011
Assets
Available-for-sale financial assets
– Listed equity investments 76,473 – – 76,473
– Unlisted equity investments – – 2,216 2,216
Derivative financial assets –13,295 –13,295
76,473 13,295 2,216 91,984
Liabilities
Derivative financial liabilities –39,223 –39,223
At March 31, 2010
Assets
Available-for-sale financial assets
– Listed equity investments 92,405 – – 92,405
– Unlisted equity investments – – 20,115 20,115
Derivative financial assets –13,283 –13,283
92,405 13,283 20,115 125,803
Liabilities
Derivative financial liabilities –11,507 –11,507
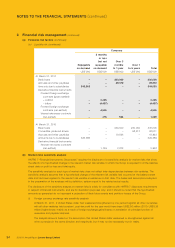
The financial instruments of the Company carried at fair value are categorized under Level 2 as follows:
2011 2010
US$’000 US$’000
Derivative financial assets –2,025
Derivative financial liabilities 5,565 3,500
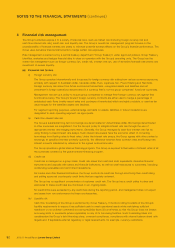
4 Critical accounting estimates and judgments
The preparation of financial statements often requires the use of judgment to select specific accounting methods and policies
from several acceptable alternatives. Estimates and judgments used in preparing the financial statements are continually
evaluated and are based on historical experience and other factors, including expectations of future events that are believed
to be reasonable under the circumstances. The Group makes estimates and assumptions concerning the future. The resulting
accounting estimates will, by definition, seldom equal the related actual results. The following is the more significant assumptions
and estimates, as well as the accounting policies and methods used in the preparation of the financial statements:
(a) Impairment of non-financial assets
The Group tests at least annually whether goodwill and other assets that have indefinite useful lives have suffered any
impairment. Other assets are reviewed for impairment whenever events or changes in circumstances indicate that the
carrying amount of the asset exceeds its recoverable amount. The recoverable amounts of an asset or a cash-generating
unit have been determined based on value-in-use calculations. These calculations require the use of estimates.