Lenovo 2011 Annual Report Download - page 21
Download and view the complete annual report
Please find page 21 of the 2011 Lenovo annual report below. You can navigate through the pages in the report by either clicking on the pages listed below, or by using the keyword search tool below to find specific information within the annual report.-
 1
1 -
2
-
3
-
4
-
5
-
6
-
7
-
8
-
9
-
10
-
 11
11 -
 12
12 -
 13
13 -
 14
14 -
 15
15 -
 16
16 -
 17
17 -
 18
18 -
 19
19 -
 20
20 -
 21
21 -
 22
22 -
 23
23 -
 24
24 -
 25
25 -
 26
26 -
 27
27 -
 28
28 -
 29
29 -
 30
30 -
 31
31 -
32
-
33
-
34
-
35
-
36
-
37
-
38
-
39
-
40
-
41
-
42
-
43
-
44
-
45
-
46
-
47
-
48
-
49
-
50
-
51
-
52
-
53
-
54
-
55
-
56
-
57
-
58
-
59
-
60
-
61
-
62
-
63
-
64
-
65
-
66
-
67
-
68
-
69
-
70
-
71
-
72
-
73
-
74
-
75
-
76
-
77
-
78
-
79
-
80
-
81
-
82
-
83
-
84
-
85
-
86
-
87
-
88
-
89
-
90
-
91
-
92
-
93
-
94
-
95
-
96
-
97
-
98
-
99
-
100
-
101
-
102
-
103
-
104
-
105
-
106
-
107
-
108
-
109
-
110
-
111
-
112
-
113
-
114
-
115
-
116
-
117
-
118
-
119
-
120
-
121
-
122
-
123
-
124
-
125
-
126
-
127
-
128
-
129
-
130
-
131
-
132
-
133
-
134
-
135
-
136
-
137
 |
 |

2010/11 Annual Report Lenovo Group Limited 23
The adjusted pre-tax income/(loss) excludes the effects of non-recurring expenditure such as restructuring costs from the operating
segments. It also excludes the effects of unrealized gains/losses on financial instruments. Interest income and expenditure are not
allocated to segments, as this type of activity is driven by the central treasury function, which manages the cash position of the
Group. A reconciliation of adjusted pre-tax income/(loss) is set out in note 5(b) to the financial statements.
Other income – net
Other income represents net gain on disposal of and dividend income received from available-for-sale financial assets.
Selling and distribution expenses
Selling and distribution expenses for the year increased by 23.7 percent as compared to last year. This is principally attributable to a
US$156 million increase in promotional activities and a US$45 million increase in employee benefit costs.
Administrative expenses
The Group experienced an increase of 27.1 percent in administrative expenses for the year as compared to last year. This is mainly
attributable to a US$143 million increase in employee benefit costs, a US$18 million increase in depreciation and amortization
expenses, and a US$6 million increase in operating lease payments. The increase is partially offset by a decrease in contracted
service expense of US$65 million.
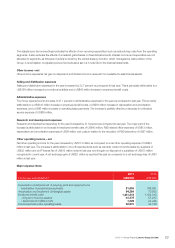
Research and development expenses
Research and development spending for the year increased by 41.6 percent as compared to last year. The major part of the
increase is attributable to an increase in employee benefit costs of US$40 million, R&D related office expenses of US$12 million,
depreciation and amortization expenses of US$4 million and costs in relation to the relocation of R&D laboratory of US$7 million.
Other operating income – net
Net other operating income for the year increased by US$113 million as compared to a net other operating expense of US$34
million in last year. The increase is attributable to one-off expense items such as warranty costs not reimbursable by suppliers of
US$30 million and an IP license fee of US$12 million noted in last year and the gain on disposal of a subsidiary of US$13 million
recognized in current year. A net exchange gain of US$21 million is reported this year as compared to a net exchange loss of US$1
million in last year.
Major expense items
For the year ended Mach 31
2011
US$’000
2010
US$’000
Depreciation and impairment of property, plant and equipment and
amortization of prepaid lease payments 81,856 106,591
Amortization and impairment of intangible assets 94,284 70,202
Employee benefit costs 1,431,218 1,182,019
– long-term incentive awards 41,375 51,413
– severance and related costs 1,095 25,448
Rental expenses under operating leases 52,670 44,729