Lenovo 2011 Annual Report Download - page 110
Download and view the complete annual report
Please find page 110 of the 2011 Lenovo annual report below. You can navigate through the pages in the report by either clicking on the pages listed below, or by using the keyword search tool below to find specific information within the annual report.-
 1
1 -
2
-
3
-
4
-
5
-
6
-
7
-
8
-
9
-
10
-
11
-
12
-
13
-
14
-
15
-
16
-
17
-
18
-
19
-
20
-
21
-
22
-
23
-
24
-
25
-
26
-
27
-
28
-
29
-
30
-
31
-
32
-
33
-
34
-
35
-
36
-
37
-
38
-
39
-
40
-
41
-
42
-
43
-
44
-
45
-
46
-
47
-
48
-
49
-
50
-
51
-
52
-
53
-
54
-
55
-
56
-
57
-
58
-
59
-
60
-
61
-
62
-
63
-
64
-
65
-
66
-
67
-
68
-
69
-
70
-
71
-
72
-
73
-
74
-
75
-
76
-
77
-
78
-
79
-
80
-
81
-
82
-
83
-
84
-
85
-
86
-
87
-
88
-
89
-
90
-
91
-
92
-
93
-
94
-
95
-
96
-
97
-
98
-
99
-
 100
100 -
 101
101 -
 102
102 -
 103
103 -
 104
104 -
 105
105 -
 106
106 -
 107
107 -
 108
108 -
 109
109 -
 110
110 -
 111
111 -
 112
112 -
 113
113 -
 114
114 -
 115
115 -
 116
116 -
 117
117 -
 118
118 -
 119
119 -
 120
120 -
121
-
122
-
123
-
124
-
125
-
126
-
127
-
128
-
129
-
130
-
131
-
132
-
133
-
134
-
135
-
136
-
137
 |
 |

2010/11 Annual Report Lenovo Group Limited 113
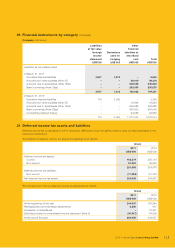
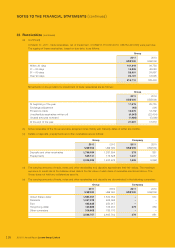
20 Financial instruments by category (continued)
Company (continued)
Liabilities
at fair value
through
income
statement
Derivatives
used for
hedging
Other
financial
liabilities at
amortized
cost Total
US$’000 US$’000 US$’000 US$’000
Liabilities as per balance sheet
At March 31, 2011
Derivative financial liabilities 4,547 1,018 –5,565
Accruals and other payables (Note 27) – – 39,319 39,319
Amounts due to subsidiaries (Note 18(b)) – – 549,503 549,503
Bank borrowings (Note 28(a)) – – 200,000 200,000
4,547 1,018 788,822 794,387
At March 31, 2010
Derivative financial liabilities 110 3,390 –3,500
Accruals and other payables (Note 27) – – 19,848 19,848
Amounts due to subsidiaries (Note 18(b)) – – 526,686 526,686
Bank borrowings (Note 28(a)) – – 430,000 430,000
Convertible preferred shares – – 94,980 94,980
110 3,390 1,071,514 1,075,014
21 Deferred income tax assets and liabilities
Deferred income tax is calculated in full on temporary differences under the liability method using the rates applicable in the
respective jurisdictions.
The analysis of deferred income tax assets and liabilities is as follows:
Group
2011 2010
US$’000 US$’000
Deferred income tax assets:
Current 193,274 205,174
Non-current 57,824 49,804
251,098 254,978
Deferred income tax liabilities:
Non-current (17,093) (10,331)
Net deferred income tax assets 234,005 244,647
The movements in the net deferred income tax assets are as follows:
Group
2011 2010
US$’000 US$’000
At the beginning of the year 244,647 190,844
Reclassification and exchange adjustments 6,305 637
Acquisition of subsidiaries –12,327
(Debited)/credited to consolidated income statement (Note 9) (16,947) 40,839
At the end of the year 234,005 244,647