Lenovo 2011 Annual Report Download - page 113
Download and view the complete annual report
Please find page 113 of the 2011 Lenovo annual report below. You can navigate through the pages in the report by either clicking on the pages listed below, or by using the keyword search tool below to find specific information within the annual report.-
 1
1 -
2
-
3
-
4
-
5
-
6
-
7
-
8
-
9
-
10
-
11
-
12
-
13
-
14
-
15
-
16
-
17
-
18
-
19
-
20
-
21
-
22
-
23
-
24
-
25
-
26
-
27
-
28
-
29
-
30
-
31
-
32
-
33
-
34
-
35
-
36
-
37
-
38
-
39
-
40
-
41
-
42
-
43
-
44
-
45
-
46
-
47
-
48
-
49
-
50
-
51
-
52
-
53
-
54
-
55
-
56
-
57
-
58
-
59
-
60
-
61
-
62
-
63
-
64
-
65
-
66
-
67
-
68
-
69
-
70
-
71
-
72
-
73
-
74
-
75
-
76
-
77
-
78
-
79
-
80
-
81
-
82
-
83
-
84
-
85
-
86
-
87
-
88
-
89
-
90
-
91
-
92
-
93
-
94
-
95
-
96
-
97
-
98
-
99
-
100
-
101
-
102
-
 103
103 -
 104
104 -
 105
105 -
 106
106 -
 107
107 -
 108
108 -
 109
109 -
 110
110 -
 111
111 -
 112
112 -
 113
113 -
 114
114 -
 115
115 -
 116
116 -
 117
117 -
 118
118 -
 119
119 -
 120
120 -
 121
121 -
 122
122 -
 123
123 -
124
-
125
-
126
-
127
-
128
-
129
-
130
-
131
-
132
-
133
-
134
-
135
-
136
-
137
 |
 |

2010/11 Annual Report Lenovo Group Limited
116
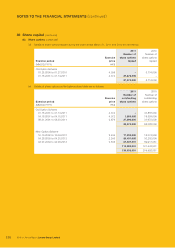
NOTES TO THE FINANCIAL STATEMENTS (continued)
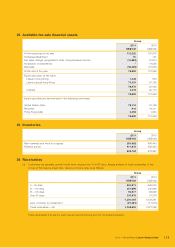
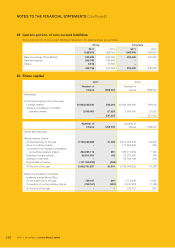
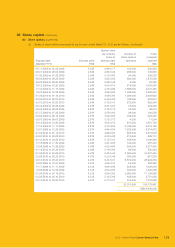
24 Receivables (continued)
(a) (continued)
At March 31, 2011, trade receivables, net of impairment, of US$213,710,000 (2010: US$182,403,000) were past due.
The ageing of these receivables, based on due date, is as follows:
Group
2011 2010
US$’000 US$’000
Within 30 days 141,819 94,758
31 – 60 days 16,809 48,083
61 – 90 days 28,901 24,967
Over 90 days 26,181 14,595
213,710 182,403
Movements on the provision for impairment of trade receivables are as follows:
Group
2011 2010
US$’000 US$’000
At beginning of the year 17,319 29,755
Exchange adjustment (45) 296
Provisions made 10,076 14,702
Uncollectible receivables written off (4,343) (22,434)
Unused amounts reversed (1,926) (5,000)
At the end of the year 21,081 17,319
(b) Notes receivable of the Group are bank accepted notes mainly with maturity dates of within six months.
(c) Details of deposits, prepayments and other receivables are as follows:
Group Company
2011 2010 2011 2010
US$’000 US$’000 US$’000 US$’000
Deposits and other receivables 1,766,184 1,287,894 379 881
Prepayments 539,141 175,528 1,247 5,017
2,305,325 1,463,422 1,626 5,898
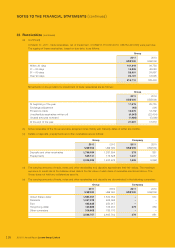
(d) The carrying amounts of trade, notes and other receivables and deposits approximate their fair values. The maximum
exposure to credit risk at the balance sheet date is the fair value of each class of receivable mentioned above. The
Group does not hold any collateral as security.
(e) The carrying amounts of trade, notes and other receivables and deposits are denominated in the following currencies:
Group Company
2011 2010 2011 2010
US$’000 US$’000 US$’000 US$’000
United States dollar 1,593,051 1,532,052 –531
Renminbi 1,057,078 625,006 ––
Euro 425,835 250,017 ––
Hong Kong dollar 130,888 105,457 379 350
Other currencies 319,905 183,170 ––
3,526,757 2,695,702 379 881