Lenovo 2011 Annual Report Download - page 124
Download and view the complete annual report
Please find page 124 of the 2011 Lenovo annual report below. You can navigate through the pages in the report by either clicking on the pages listed below, or by using the keyword search tool below to find specific information within the annual report.-
 1
1 -
2
-
3
-
4
-
5
-
6
-
7
-
8
-
9
-
10
-
11
-
12
-
13
-
14
-
15
-
16
-
17
-
18
-
19
-
20
-
21
-
22
-
23
-
24
-
25
-
26
-
27
-
28
-
29
-
30
-
31
-
32
-
33
-
34
-
35
-
36
-
37
-
38
-
39
-
40
-
41
-
42
-
43
-
44
-
45
-
46
-
47
-
48
-
49
-
50
-
51
-
52
-
53
-
54
-
55
-
56
-
57
-
58
-
59
-
60
-
61
-
62
-
63
-
64
-
65
-
66
-
67
-
68
-
69
-
70
-
71
-
72
-
73
-
74
-
75
-
76
-
77
-
78
-
79
-
80
-
81
-
82
-
83
-
84
-
85
-
86
-
87
-
88
-
89
-
90
-
91
-
92
-
93
-
94
-
95
-
96
-
97
-
98
-
99
-
100
-
101
-
102
-
103
-
104
-
105
-
106
-
107
-
108
-
109
-
110
-
111
-
112
-
113
-
 114
114 -
 115
115 -
 116
116 -
 117
117 -
 118
118 -
 119
119 -
 120
120 -
 121
121 -
 122
122 -
 123
123 -
 124
124 -
 125
125 -
 126
126 -
 127
127 -
 128
128 -
 129
129 -
 130
130 -
 131
131 -
 132
132 -
 133
133 -
 134
134 -
135
-
136
-
137
 |
 |

2010/11 Annual Report Lenovo Group Limited 127
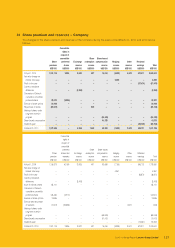
31 Share premium and reserves – Company
The changes in the share premium and reserves of the Company during the years ended March 31, 2011 and 2010 are as
follows:
Share
premium
Convertible
rights in
respect of
convertible
preferred
shares
Exchange
reserve
Share
redemption
reserve
Share-based
compensation
reserve
Hedging
reserve
Other
reserve
Retained
earnings Total
US$’000 US$’000 US$’000 US$’000 US$’000 US$’000 US$’000 US$’000 US$’000
At April 1, 2010 1,341,118 2,836 9,522 497 76,054 (3,398) 3,570 570,311 2,000,510
Fair value change on
interest rate swap – – – – – 2,365 – – 2,365
Profit for the year – – – – – – – (57,474) (57,474)
Currency translation
differences – – (5,263) – – – – – (5,263)
Conversion of Series A
cumulative convertible
preferred shares 98,073 (2,836) – – – – – – 95,237
Exercise of share options 24,948 ––– ––––24,948
Repurchase of shares (86,610) – – 506 – – – – (86,104)
Vesting of shares under
long-term incentive
program ––––(54,149) –––(54,149)
Share-based compensation – – – – 41,375 – – – 41,375
Dividends paid – – – – – – – (89,706) (89,706)
At March 31, 2011 1,377,529 –4,259 1,003 63,280 (1,033) 3,570 423,131 1,871,739
Share
premium
Convertible
rights in
respect of
convertible
preferred
shares and
warrants
Exchange
reserve
Share
redemption
reserve
Share-based
compensation
reserve
Hedging
reserve
Other
reserve
Retained
earnings Total
US$’000 US$’000 US$’000 US$’000 US$’000 US$’000 US$’000 US$’000 US$’000
At April 1, 2009 1,106,379 42,159 12,925 497 92,684 (7,765) –545,702 1,792,581
Fair value change on
interest rate swap – – – – – 4,367 – – 4,367
Profit for the year –––– –––36,876 36,876
Currency translation
differences – – (3,403) – – – – – (3,403)
Issue of ordinary shares 63,141 – – – – – – – 63,141
Conversion of Series A
cumulative convertible
preferred shares 126,484 (3,970) – – – – – – 122,514
Exercise of share options 13,536 – – – – – – – 13,536
Exercise and repurchase
of warrants 31,578 (35,353) – – – – 3,570 –(205)
Vesting of shares under
long-term incentive
program ––––(68,043) – – – (68,043)
Share-based compensation ––––51,413 –––51,413
Dividends paid – – – – – – – (12,267) (12,267)
At March 31, 2010 1,341,118 2,836 9,522 497 76,054 (3,398) 3,570 570,311 2,000,510