Lenovo 2011 Annual Report Download - page 129
Download and view the complete annual report
Please find page 129 of the 2011 Lenovo annual report below. You can navigate through the pages in the report by either clicking on the pages listed below, or by using the keyword search tool below to find specific information within the annual report.-
 1
1 -
2
-
3
-
4
-
5
-
6
-
7
-
8
-
9
-
10
-
11
-
12
-
13
-
14
-
15
-
16
-
17
-
18
-
19
-
20
-
21
-
22
-
23
-
24
-
25
-
26
-
27
-
28
-
29
-
30
-
31
-
32
-
33
-
34
-
35
-
36
-
37
-
38
-
39
-
40
-
41
-
42
-
43
-
44
-
45
-
46
-
47
-
48
-
49
-
50
-
51
-
52
-
53
-
54
-
55
-
56
-
57
-
58
-
59
-
60
-
61
-
62
-
63
-
64
-
65
-
66
-
67
-
68
-
69
-
70
-
71
-
72
-
73
-
74
-
75
-
76
-
77
-
78
-
79
-
80
-
81
-
82
-
83
-
84
-
85
-
86
-
87
-
88
-
89
-
90
-
91
-
92
-
93
-
94
-
95
-
96
-
97
-
98
-
99
-
100
-
101
-
102
-
103
-
104
-
105
-
106
-
107
-
108
-
109
-
110
-
111
-
112
-
113
-
114
-
115
-
116
-
117
-
118
-
 119
119 -
 120
120 -
 121
121 -
 122
122 -
 123
123 -
 124
124 -
 125
125 -
 126
126 -
 127
127 -
 128
128 -
 129
129 -
 130
130 -
 131
131 -
 132
132 -
 133
133 -
 134
134 -
 135
135 -
 136
136 -
 137
137
 |
 |

2010/11 Annual Report Lenovo Group Limited
132
NOTES TO THE FINANCIAL STATEMENTS (continued)
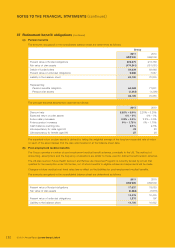
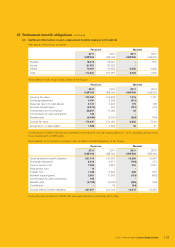
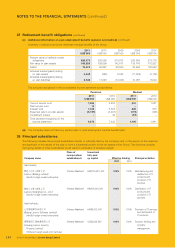
37 Retirement benefit obligations (continued)
(a) Pension benefits
The amounts recognized in the consolidated balance sheet are determined as follows:
Group
2011 2010
US$’000 US$’000
Present value of funded obligations 228,275 213,769
Fair value of plan assets (174,241) (151,081)
Deficit of funded plans 54,034 62,688
Present value of unfunded obligations 9,086 7,547
Liability in the balance sheet 63,120 70,235
Representing:
Pension benefits obligation 64,362 71,631
Pension plan assets (1,242) (1,396)
63,120 70,235
The principal actuarial assumptions used are as follows:
2011 2010
Discount rate 2.25% – 5.0% 2.25% – 5.25%
Expected return on plan assets 0% – 5% 0% – 5%
Future salary increases 2.2% – 3.5% 2.2% – 3.5%
Future pension increases 0% – 1.75% 0% – 1.75%
Cash balance crediting rate 2.5% 2.5%
Life expectancy for male aged 60 23 23
Life expectancy for female aged 60 27 26
The expected return on plan assets is derived by taking the weighted average of the long term expected rate of return
on each of the asset classes that the plan was invested in at the balance sheet date.
(b) Post-employment medical benefits
The Group operates a number of post-employment medical benefit schemes, principally in the US. The method of
accounting, assumptions and the frequency of valuations are similar to those used for defined benefit pension schemes.
The US plan (Lenovo Future Health Account and Retiree Life Insurance Program) is currently funded by a trust that
qualifies for tax exemption under US tax law, out of which benefits to eligible retirees and dependents will be made.
Changes in future medical cost trend rates has no effect on the liabilities for post-employment medical benefits.
The amounts recognized in the consolidated balance sheet are determined as follows:
2011 2010
US$’000 US$’000
Present value of funded obligations 17,037 18,053
Fair value of plan assets (6,562) (7,618)
10,475 10,435
Present value of unfunded obligations 1,275 197
Liability in the balance sheet 11,750 10,632