Lenovo 2011 Annual Report Download - page 117
Download and view the complete annual report
Please find page 117 of the 2011 Lenovo annual report below. You can navigate through the pages in the report by either clicking on the pages listed below, or by using the keyword search tool below to find specific information within the annual report.-
 1
1 -
2
-
3
-
4
-
5
-
6
-
7
-
8
-
9
-
10
-
11
-
12
-
13
-
14
-
15
-
16
-
17
-
18
-
19
-
20
-
21
-
22
-
23
-
24
-
25
-
26
-
27
-
28
-
29
-
30
-
31
-
32
-
33
-
34
-
35
-
36
-
37
-
38
-
39
-
40
-
41
-
42
-
43
-
44
-
45
-
46
-
47
-
48
-
49
-
50
-
51
-
52
-
53
-
54
-
55
-
56
-
57
-
58
-
59
-
60
-
61
-
62
-
63
-
64
-
65
-
66
-
67
-
68
-
69
-
70
-
71
-
72
-
73
-
74
-
75
-
76
-
77
-
78
-
79
-
80
-
81
-
82
-
83
-
84
-
85
-
86
-
87
-
88
-
89
-
90
-
91
-
92
-
93
-
94
-
95
-
96
-
97
-
98
-
99
-
100
-
101
-
102
-
103
-
104
-
105
-
106
-
 107
107 -
 108
108 -
 109
109 -
 110
110 -
 111
111 -
 112
112 -
 113
113 -
 114
114 -
 115
115 -
 116
116 -
 117
117 -
 118
118 -
 119
119 -
 120
120 -
 121
121 -
 122
122 -
 123
123 -
 124
124 -
 125
125 -
 126
126 -
 127
127 -
128
-
129
-
130
-
131
-
132
-
133
-
134
-
135
-
136
-
137
 |
 |

2010/11 Annual Report Lenovo Group Limited
120
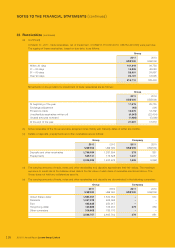
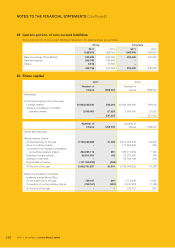
NOTES TO THE FINANCIAL STATEMENTS (continued)
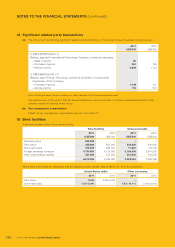
29 Current portion of non-current liabilities
The current portion of non-current liabilities presented in the balance sheet are as follow:
Group Company
2011 2010 2011 2010
US$’000 US$’000 US$’000 US$’000
Bank borrowings (Note 28(a)(i)) 200,000 230,000 200,000 230,000
Deferred revenue 245,793 196,806 ––
Others 3,913 10,550 ––
449,706 437,356 200,000 230,000
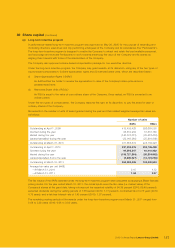
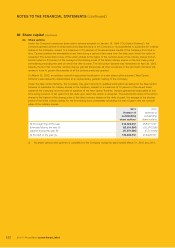
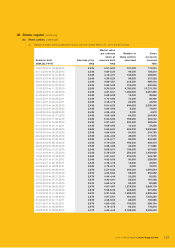
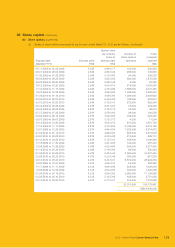
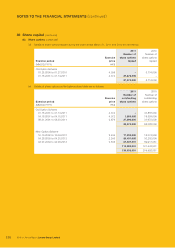
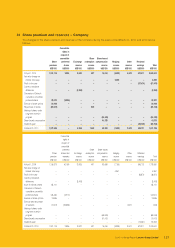
30 Share capital
2011 2010
Number of
shares HK$’000
Number of
shares HK$’000
Authorized:
At the beginning and end of the year
Ordinary shares 20,000,000,000 500,000 20,000,000,000 500,000
Series A cumulative convertible
preferred shares 3,000,000 27,525 3,000,000 27,525
527,525 527,525
Number of
shares US$’000
Number of
shares US$’000
Issued and fully paid:
Voting ordinary shares:
At the beginning of the year 9,788,044,282 31,388 9,211,389,406 29,530
Issue of ordinary shares – – 111,668,936 359
Conversion from Series A cumulative
convertible preferred shares 282,263,115 891 369,112,652 1,190
Exercise of share options 52,614,500 168 32,370,500 104
Exercise of warrants – – 63,502,788 205
Repurchase of shares (157,760,000) (506) – –
At the end of the year 9,965,161,897 31,941 9,788,044,282 31,388
Series A cumulative convertible
preferred shares (Note 28(b)):
At the beginning of the year 769,167 891 1,774,999 2,081
Conversion to voting ordinary shares (769,167) (891) (1,005,832) (1,190)
At the end of the year – – 769,167 891