Lenovo 2011 Annual Report Download - page 43
Download and view the complete annual report
Please find page 43 of the 2011 Lenovo annual report below. You can navigate through the pages in the report by either clicking on the pages listed below, or by using the keyword search tool below to find specific information within the annual report.-
 1
1 -
2
-
3
-
4
-
5
-
6
-
7
-
8
-
9
-
10
-
11
-
12
-
13
-
14
-
15
-
16
-
17
-
18
-
19
-
20
-
21
-
22
-
23
-
24
-
25
-
26
-
27
-
28
-
29
-
30
-
31
-
32
-
 33
33 -
 34
34 -
 35
35 -
 36
36 -
 37
37 -
 38
38 -
 39
39 -
 40
40 -
 41
41 -
 42
42 -
 43
43 -
 44
44 -
 45
45 -
 46
46 -
 47
47 -
 48
48 -
 49
49 -
 50
50 -
 51
51 -
 52
52 -
 53
53 -
54
-
55
-
56
-
57
-
58
-
59
-
60
-
61
-
62
-
63
-
64
-
65
-
66
-
67
-
68
-
69
-
70
-
71
-
72
-
73
-
74
-
75
-
76
-
77
-
78
-
79
-
80
-
81
-
82
-
83
-
84
-
85
-
86
-
87
-
88
-
89
-
90
-
91
-
92
-
93
-
94
-
95
-
96
-
97
-
98
-
99
-
100
-
101
-
102
-
103
-
104
-
105
-
106
-
107
-
108
-
109
-
110
-
111
-
112
-
113
-
114
-
115
-
116
-
117
-
118
-
119
-
120
-
121
-
122
-
123
-
124
-
125
-
126
-
127
-
128
-
129
-
130
-
131
-
132
-
133
-
134
-
135
-
136
-
137
 |
 |

2010/11 Annual Report Lenovo Group Limited
46
CORPORATE GOVERNANCE
The investor relations team values and is eager to hear suggestions and comments from shareholders and investors
through sending emails to [email protected].
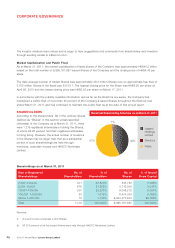
Market Capitalization and Public Float
As at March 31, 2011, the market capitalization of listed shares of the Company was approximately HK$44.3 billion
based on the total number of 9,995,161,897 issued Shares of the Company and the closing price of HK$4.43 per
share.
The daily average number of traded Shares was approximately 49.5 million Shares over an approximate free float of
5,700 million Shares in the fiscal year 2010/11. The highest closing price for the Share was HK$6.20 per share on
April 26, 2010 and the lowest closing price was HK$3.93 per share on March 17, 2011.
In accordance with the publicly available information and as far as the Directors are aware, the Company has
maintained a public float of more than 25 percent of the Company’s issued Shares throughout the financial year
ended March 31, 2011 and has continued to maintain the public float as at the date of this annual report.
SHAREHOLDERS
According to the shareholders’ list of the ordinary shares
(defined as “Shares” in this section unless specified
otherwise) of the Company as at March 31, 2011, there
were 1,319 registered shareholders holding the Shares,
of whom 98.26 percent had their registered addresses
in Hong Kong. However, the actual number of investors
in the Shares may be larger than that as a substantial
portion of such shareholdings are held through
nominees, custodian houses and HKSCC Nominees
Limited.
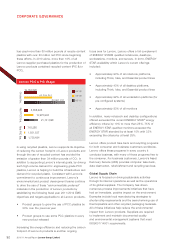
Beneficial Shareholding Structure as at March 31, 2011
Legend
Holdings
Limited
Public
Directors
1%
42%
57%
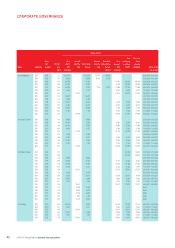
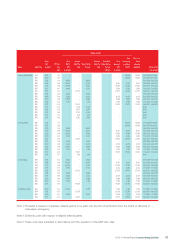
Shareholdings as at March 31, 2011
Size of Registered
Shareholdings
No. of
Shareholders
% of
Shareholders
No. of
Shares
% of Issued
Share Capital
2,000 or below 301 22.820% 545,782 0.005%
2,001-10,000 676 51.252% 4,716,000 0.047%
10,001-100,000 307 23.275% 9,048,272 0.091%
100,001-1,000,000 20 1.516% 6,474,000 0.065%
Above 1,000,000 15 1.137% 9,974,377,843 99.792%
Total 1,319 100.000% 9,995,161,897 100.000%
Remarks:
(i) A board lot size comprises 2,000 Shares.
(ii) 56.373 percent of all the issued Shares were held through HKSCC Nominees Limited.