Lenovo 2011 Annual Report Download - page 123
Download and view the complete annual report
Please find page 123 of the 2011 Lenovo annual report below. You can navigate through the pages in the report by either clicking on the pages listed below, or by using the keyword search tool below to find specific information within the annual report.-
 1
1 -
 2
2 -
 3
3 -
 4
4 -
 5
5 -
 6
6 -
 7
7 -
 8
8 -
 9
9 -
 10
10 -
 11
11 -
 12
12 -
 13
13 -
 14
14 -
 15
15 -
 16
16 -
 17
17 -
 18
18 -
 19
19 -
 20
20 -
 21
21 -
 22
22 -
 23
23 -
 24
24 -
 25
25 -
 26
26 -
 27
27 -
 28
28 -
 29
29 -
 30
30 -
 31
31 -
 32
32 -
 33
33 -
 34
34 -
 35
35 -
 36
36 -
 37
37 -
 38
38 -
 39
39 -
 40
40 -
 41
41 -
 42
42 -
 43
43 -
 44
44 -
 45
45 -
 46
46 -
 47
47 -
 48
48 -
 49
49 -
 50
50 -
 51
51 -
 52
52 -
 53
53 -
 54
54 -
 55
55 -
 56
56 -
 57
57 -
 58
58 -
 59
59 -
 60
60 -
 61
61 -
 62
62 -
 63
63 -
 64
64 -
 65
65 -
 66
66 -
 67
67 -
 68
68 -
 69
69 -
 70
70 -
 71
71 -
 72
72 -
 73
73 -
 74
74 -
 75
75 -
 76
76 -
 77
77 -
 78
78 -
 79
79 -
 80
80 -
 81
81 -
 82
82 -
 83
83 -
 84
84 -
 85
85 -
 86
86 -
 87
87 -
 88
88 -
 89
89 -
 90
90 -
 91
91 -
 92
92 -
 93
93 -
 94
94 -
 95
95 -
 96
96 -
 97
97 -
 98
98 -
 99
99 -
 100
100 -
 101
101 -
 102
102 -
 103
103 -
 104
104 -
 105
105 -
 106
106 -
 107
107 -
 108
108 -
 109
109 -
 110
110 -
 111
111 -
 112
112 -
 113
113 -
 114
114 -
 115
115 -
 116
116 -
 117
117 -
 118
118 -
 119
119 -
 120
120 -
 121
121 -
 122
122 -
 123
123 -
 124
124 -
 125
125 -
 126
126 -
 127
127 -
 128
128 -
 129
129 -
 130
130 -
 131
131 -
 132
132 -
 133
133 -
 134
134 -
 135
135 -
 136
136 -
 137
137
 |
 |

2010/11 Annual Report Lenovo Group Limited
126
NOTES TO THE FINANCIAL STATEMENTS (continued)
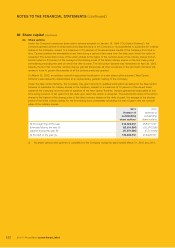
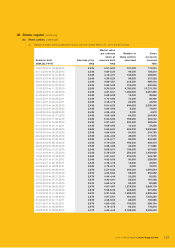
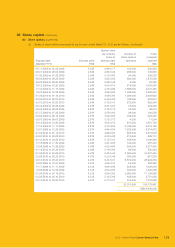
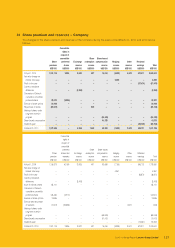
30 Share capital (continued)
(b) Share options (continued)
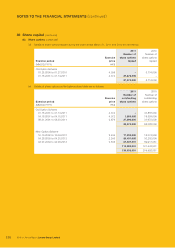
(iii) Details of share options lapsed during the years ended March 31, 2011 and 2010 are as follows:
2011 2010
Exercise period
Exercise
price
Number of
share options
lapsed
Number of
share options
lapsed
(MM.DD.YYYY) HK$
Old Option Scheme
01.28.2000 to 01.27.2010 4.038 –5,714,000
01.15.2001 to 01.14.2011 4.312 27,674,000 –
27,674,000 5,714,000
(iv) Details of share options at the balance sheet date are as follows:
2011 2010
Exercise period
Exercise
price
Number of
outstanding
share options
Number of
outstanding
share options
(MM.DD.YYYY) HK$
Old Option Scheme
01.15.2001 to 01.14.2011 4.312 –47,887,000
04.16.2001 to 04.15.2011 4.072 1,380,000 18,524,000
08.31.2001 to 08.30.2011 2.876 27,290,000 31,972,000
28,670,000 98,383,000
New Option Scheme
10.10.2002 to 10.09.2012 2.435 17,030,000 18,374,500
04.26.2003 to 04.25.2013 2.245 26,401,000 33,252,000
04.27.2004 to 04.26.2014 2.545 67,537,051 69,917,051
110,968,051 121,543,551
139,638,051 219,926,551
