Lenovo 2011 Annual Report Download - page 74
Download and view the complete annual report
Please find page 74 of the 2011 Lenovo annual report below. You can navigate through the pages in the report by either clicking on the pages listed below, or by using the keyword search tool below to find specific information within the annual report.-
 1
1 -
2
-
3
-
4
-
5
-
6
-
7
-
8
-
9
-
10
-
11
-
12
-
13
-
14
-
15
-
16
-
17
-
18
-
19
-
20
-
21
-
22
-
23
-
24
-
25
-
26
-
27
-
28
-
29
-
30
-
31
-
32
-
33
-
34
-
35
-
36
-
37
-
38
-
39
-
40
-
41
-
42
-
43
-
44
-
45
-
46
-
47
-
48
-
49
-
50
-
51
-
52
-
53
-
54
-
55
-
56
-
57
-
58
-
59
-
60
-
61
-
62
-
63
-
 64
64 -
 65
65 -
 66
66 -
 67
67 -
 68
68 -
 69
69 -
 70
70 -
 71
71 -
 72
72 -
 73
73 -
 74
74 -
 75
75 -
 76
76 -
 77
77 -
 78
78 -
 79
79 -
 80
80 -
 81
81 -
 82
82 -
 83
83 -
 84
84 -
85
-
86
-
87
-
88
-
89
-
90
-
91
-
92
-
93
-
94
-
95
-
96
-
97
-
98
-
99
-
100
-
101
-
102
-
103
-
104
-
105
-
106
-
107
-
108
-
109
-
110
-
111
-
112
-
113
-
114
-
115
-
116
-
117
-
118
-
119
-
120
-
121
-
122
-
123
-
124
-
125
-
126
-
127
-
128
-
129
-
130
-
131
-
132
-
133
-
134
-
135
-
136
-
137
 |
 |
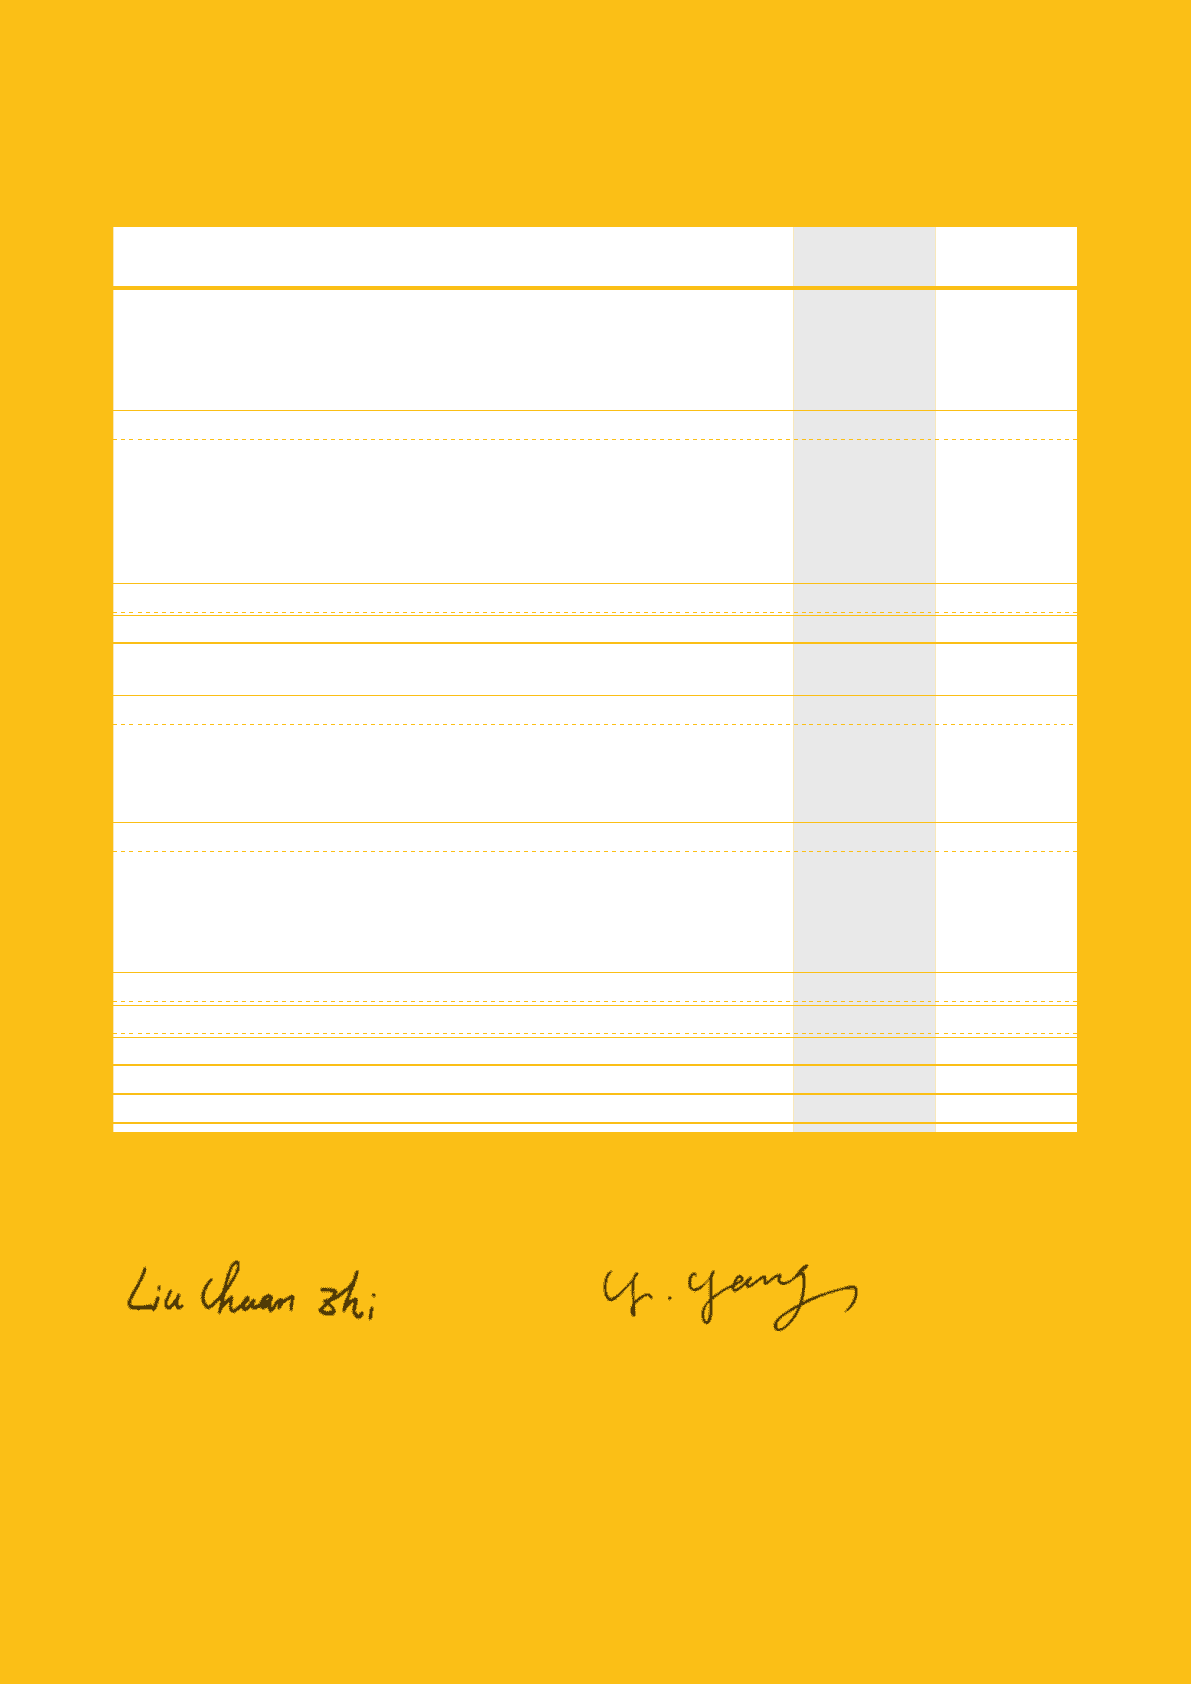
2010/11 Annual Report Lenovo Group Limited 77
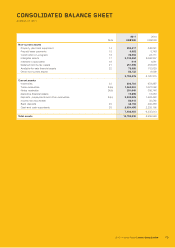
BALANCE SHEET
At March 31, 2011
2011 2010
Note US$’000 US$’000
Non-current assets
Property, plant and equipment 14 689 806
Construction-in-progress 16 3,602 2,204
Intangible assets 17 24,771 23,183
Investments in subsidiaries 18(a) 1,929,073 1,898,912
1,958,135 1,925,105
Current assets
Derivative financial assets –2,025
Deposits, prepayments and other receivables 24(c) 1,626 5,898
Amounts due from subsidiaries 18(b) 692,351 914,325
Bank deposits 25 20,000 –
Cash and cash equivalents 25 25,955 259,559
739,932 1,181,807
Total assets 2,698,067 3,106,912
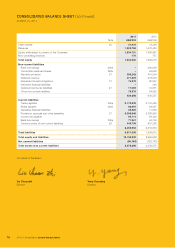
Share capital 30 31,941 31,388
Reserves 31 1,871,739 2,000,510
Total equity 1,903,680 2,031,898
Non-current liabilities
Bank borrowings 28(a) –200,000
Convertible preferred shares 28(b) –94,980
Derivative financial liabilities –248
–295,228
Current liabilities
Derivative financial liabilities 5,565 3,252
Provisions, accruals and other payables 27 39,319 19,848
Amounts due to subsidiaries 18(b) 549,503 526,686
Current portion of non-current liabilities 29 200,000 230,000
794,387 779,786
Total liabilities 794,387 1,075,014
Total equity and liabilities 2,698,067 3,106,912
Net current (liabilities)/assets (54,455) 402,021
Total assets less current liabilities 1,903,680 2,327,126
On behalf of the Board
Liu Chuanzhi Yang Yuanqing
Director Director