Lenovo 2011 Annual Report Download - page 130
Download and view the complete annual report
Please find page 130 of the 2011 Lenovo annual report below. You can navigate through the pages in the report by either clicking on the pages listed below, or by using the keyword search tool below to find specific information within the annual report.-
 1
1 -
2
-
3
-
4
-
5
-
6
-
7
-
8
-
9
-
10
-
11
-
12
-
13
-
14
-
15
-
16
-
17
-
18
-
19
-
20
-
21
-
22
-
23
-
24
-
25
-
26
-
27
-
28
-
29
-
30
-
31
-
32
-
33
-
34
-
35
-
36
-
37
-
38
-
39
-
40
-
41
-
42
-
43
-
44
-
45
-
46
-
47
-
48
-
49
-
50
-
51
-
52
-
53
-
54
-
55
-
56
-
57
-
58
-
59
-
60
-
61
-
62
-
63
-
64
-
65
-
66
-
67
-
68
-
69
-
70
-
71
-
72
-
73
-
74
-
75
-
76
-
77
-
78
-
79
-
80
-
81
-
82
-
83
-
84
-
85
-
86
-
87
-
88
-
89
-
90
-
91
-
92
-
93
-
94
-
95
-
96
-
97
-
98
-
99
-
100
-
101
-
102
-
103
-
104
-
105
-
106
-
107
-
108
-
109
-
110
-
111
-
112
-
113
-
114
-
115
-
116
-
117
-
118
-
119
-
 120
120 -
 121
121 -
 122
122 -
 123
123 -
 124
124 -
 125
125 -
 126
126 -
 127
127 -
 128
128 -
 129
129 -
 130
130 -
 131
131 -
 132
132 -
 133
133 -
 134
134 -
 135
135 -
 136
136 -
 137
137
 |
 |

2010/11 Annual Report Lenovo Group Limited 133
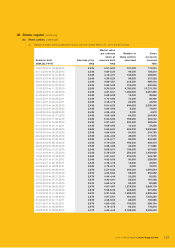
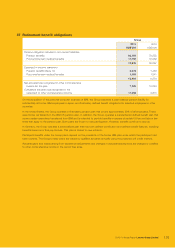
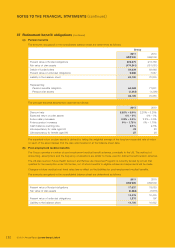
37 Retirement benefit obligations (continued)
(c) Additional information on post-employment benefits (pension and medical)
Plan assets of the Group comprise:
Pensions Medical
2011 2010 2011 2010
US$’000 US$’000 US$’000 US$’000
Equities 12,613 25,901 –810
Bonds 81,661 83,622 ––
Others 79,967 41,558 6,562 6,808
Total 174,241 151,081 6,562 7,618
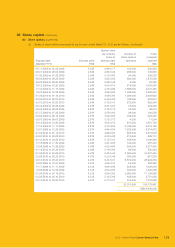
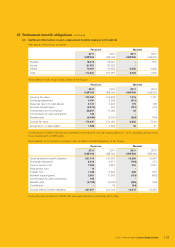
Reconciliation of fair value of plan assets of the Group:
Pensions Medical
2011 2010 2011 2010
US$’000 US$’000 US$’000 US$’000
Opening fair value 151,081 134,852 7,618 7,761
Exchange adjustment 4,491 6,209 (810) –
Expected return on plan assets 5,197 3,947 179 196
Actuarial (losses)/gains (3,511) 561 (131) (175)
Contributions by the employer 23,367 11,088 30 –
Contributions by plan participants 165 –––
Benefits paid (6,549) (5,576) (324) (164)
Closing fair value 174,241 151,081 6,562 7,618
Actual return on plan assets 1,686 4,508 48 21
Contributions of US$16,364,000 are estimated to be made for the year ending March 31, 2012, excluding amounts due
to be transferred from IBM plans.
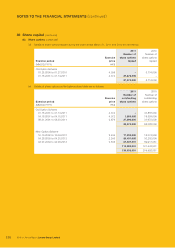
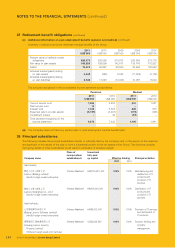
Reconciliation of movements in present value of defined benefit obligations of the Group:
Pensions Medical
2011 2010 2011 2010
US$’000 US$’000 US$’000 US$’000
Opening defined benefit obligation 221,316 193,967 18,250 16,646
Exchange adjustment 3,918 9,677 (766) 373
Current service cost 7,655 4,833 551 1,221
Past service cost 14 –––
Interest cost 7,406 6,505 828 816
Actuarial losses/(gains) 3,681 11,868 (133) (642)
Contributions by plan participants 165 –––
Benefits paid (6,794) (5,576) (324) (164)
Curtailments –42 (94) –
Closing defined benefit obligation 237,361 221,316 18,312 18,250
During the year benefits of US$245,000 were paid directly by the Group (2010: Nil).