Lenovo 2011 Annual Report Download - page 102
Download and view the complete annual report
Please find page 102 of the 2011 Lenovo annual report below. You can navigate through the pages in the report by either clicking on the pages listed below, or by using the keyword search tool below to find specific information within the annual report.-
 1
1 -
2
-
3
-
4
-
5
-
6
-
7
-
8
-
9
-
10
-
11
-
12
-
13
-
14
-
15
-
16
-
17
-
18
-
19
-
20
-
21
-
22
-
23
-
24
-
25
-
26
-
27
-
28
-
29
-
30
-
31
-
32
-
33
-
34
-
35
-
36
-
37
-
38
-
39
-
40
-
41
-
42
-
43
-
44
-
45
-
46
-
47
-
48
-
49
-
50
-
51
-
52
-
53
-
54
-
55
-
56
-
57
-
58
-
59
-
60
-
61
-
62
-
63
-
64
-
65
-
66
-
67
-
68
-
69
-
70
-
71
-
72
-
73
-
74
-
75
-
76
-
77
-
78
-
79
-
80
-
81
-
82
-
83
-
84
-
85
-
86
-
87
-
88
-
89
-
90
-
91
-
 92
92 -
 93
93 -
 94
94 -
 95
95 -
 96
96 -
 97
97 -
 98
98 -
 99
99 -
 100
100 -
 101
101 -
 102
102 -
 103
103 -
 104
104 -
 105
105 -
 106
106 -
 107
107 -
 108
108 -
 109
109 -
 110
110 -
 111
111 -
 112
112 -
113
-
114
-
115
-
116
-
117
-
118
-
119
-
120
-
121
-
122
-
123
-
124
-
125
-
126
-
127
-
128
-
129
-
130
-
131
-
132
-
133
-
134
-
135
-
136
-
137
 |
 |

2010/11 Annual Report Lenovo Group Limited 105
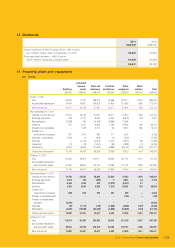
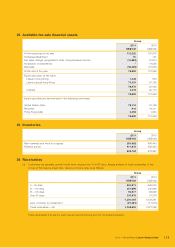
13 Dividends
2011 2010
US$’000 US$’000
Interim dividend of HK2.6 cents (2010: HK1.0 cent)
per ordinary share, paid on December 9, 2010 32,581 12,264
Proposed final dividend – HK5.0 cents
(2010: HK4.5 cents) per ordinary share 64,020 56,464
96,601 68,728
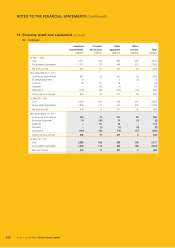
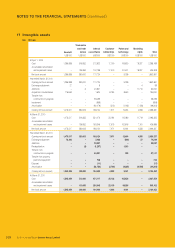
14 Property, plant and equipment
(a) Group
Buildings
Leasehold
improve-
ments
Plant and
machinery
Furniture
and fixtures
Office
equipment
Motor
vehicles Total
US$’000 US$’000 US$’000 US$’000 US$’000 US$’000 US$’000
At April 1, 2009
Cost 115,948 74,761 226,812 43,096 223,217 2,318 686,152
Accumulated depreciation 24,676 40,967 158,975 14,624 131,403 1,365 372,010
Net book amount 91,272 33,794 67,837 28,472 91,814 953 314,142
Year ended March 31, 2010
Opening net book amount 91,272 33,794 67,837 28,472 91,814 953 314,142
Exchange adjustment 756 (1,371) 8,642 4,224 (9,676) (34) 2,541
Reclassification (2,536) 482 (10,553) (5,658) 18,265 – –
Additions 337 5,410 9,984 1,065 19,092 256 36,144
Acquisition of subsidiaries –7,028 5,010 26 3,974 682 16,720
Transfer from
construction-in-progress 337 1,970 564 471 1,816 –5,158
Disposals of subsidiaries (7,523) (1) (305) (3) (323) –(8,155)
Disposals –(2,744) (2,670) (1,501) (4,815) (93) (11,823)
Impairment (74) (73) (1,061) (98) (4,385) (74) (5,765)
Depreciation (2,801) (9,614) (41,622) (6,638) (39,742) (284) (100,701)
Closing net book amount 79,768 34,881 35,826 20,360 76,020 1,406 248,261
At March 31, 2010
Cost 102,020 88,815 214,617 38,646 252,781 3,244 700,123
Accumulated depreciation
and impairment losses 22,252 53,934 178,791 18,286 176,761 1,838 451,862
Net book amount 79,768 34,881 35,826 20,360 76,020 1,406 248,261
Year ended March 31, 2011
Opening net book amount 79,768 34,881 35,826 20,360 76,020 1,406 248,261
Exchange adjustment 3,373 132 (289) 52,847 54 6,122
Reclassification 4,483 1,089 369 (3,075) (2,947) 81 –
Additions 1,320 6,544 5,820 1,016 33,351 783 48,834
Transfer from
construction-in-progress 688 604 515 491 525 –2,823
Transfer to intangible assets – – – – (748) –(748)
Transfer to prepaid lease
payments (5,866) – – – – – (5,866)
Disposals (19) (1,110) (172) (1,682) (5,086) (180) (8,249)
Depreciation (3,945) (10,899) (24,062) (8,685) (33,626) (543) (81,760)
Closing net book amount 79,802 31,241 18,007 8,430 70,336 1,601 209,417
At March 31, 2011
Cost 118,374 81,009 234,522 28,613 231,133 3,457 697,108
Accumulated depreciation
and impairment losses 38,572 49,768 216,515 20,183 160,797 1,856 487,691
Net book amount 79,802 31,241 18,007 8,430 70,336 1,601 209,417