Lenovo 2011 Annual Report Download - page 109
Download and view the complete annual report
Please find page 109 of the 2011 Lenovo annual report below. You can navigate through the pages in the report by either clicking on the pages listed below, or by using the keyword search tool below to find specific information within the annual report.-
 1
1 -
2
-
3
-
4
-
5
-
6
-
7
-
8
-
9
-
10
-
11
-
12
-
13
-
14
-
15
-
16
-
17
-
18
-
19
-
20
-
21
-
22
-
23
-
24
-
25
-
26
-
27
-
28
-
29
-
30
-
31
-
32
-
33
-
34
-
35
-
36
-
37
-
38
-
39
-
40
-
41
-
42
-
43
-
44
-
45
-
46
-
47
-
48
-
49
-
50
-
51
-
52
-
53
-
54
-
55
-
56
-
57
-
58
-
59
-
60
-
61
-
62
-
63
-
64
-
65
-
66
-
67
-
68
-
69
-
70
-
71
-
72
-
73
-
74
-
75
-
76
-
77
-
78
-
79
-
80
-
81
-
82
-
83
-
84
-
85
-
86
-
87
-
88
-
89
-
90
-
91
-
92
-
93
-
94
-
95
-
96
-
97
-
98
-
 99
99 -
 100
100 -
 101
101 -
 102
102 -
 103
103 -
 104
104 -
 105
105 -
 106
106 -
 107
107 -
 108
108 -
 109
109 -
 110
110 -
 111
111 -
 112
112 -
 113
113 -
 114
114 -
 115
115 -
 116
116 -
 117
117 -
 118
118 -
 119
119 -
120
-
121
-
122
-
123
-
124
-
125
-
126
-
127
-
128
-
129
-
130
-
131
-
132
-
133
-
134
-
135
-
136
-
137
 |
 |

2010/11 Annual Report Lenovo Group Limited
112
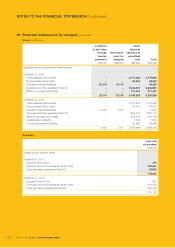
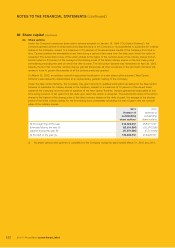
NOTES TO THE FINANCIAL STATEMENTS (continued)
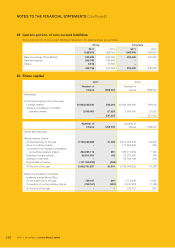
20 Financial instruments by category (continued)
Group (continued)
Liabilities
at fair value
through
income
statement
Derivatives
used for
hedging
Other
financial
liabilities at
amortized
cost Total
US$’000 US$’000 US$’000 US$’000
Liabilities as per consolidated balance sheet
At March 31, 2011
Trade payables (Note 26(a)) – – 2,179,839 2,179,839
Notes payable (Note 26(b)) – – 98,964 98,964
Derivative financial liabilities 20,110 19,113 –39,223
Accruals and other payables (Note 27) – – 3,648,921 3,648,921
Bank borrowings (Note 28(a)) – – 271,561 271,561
20,110 19,113 6,199,285 6,238,508
At March 31, 2010
Trade payables (Note 26(a)) – – 3,141,426 3,141,426
Notes payable (Note 26(b)) – – 94,427 94,427
Derivative financial liabilities 3,950 7,557 –11,507
Accruals and other payables (Note 27) – – 1,850,117 1,850,117
Bank borrowings (Note 28(a)) – – 494,706 494,706
Capital lease obligation – – 1,240 1,240
Convertible preferred shares – – 94,980 94,980
3,950 7,557 5,676,896 5,688,403
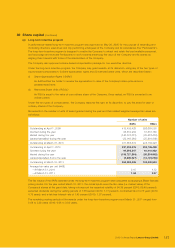
Company
Loan and
receivables
US$’000
Assets as per balance sheet
At March 31, 2011
Deposits (Note 24(c)) 379
Amounts due from subsidiaries (Note 18(b)) 692,351
Cash and cash equivalents (Note 25) 25,955
718,685
At March 31, 2010
Deposits (Note 24 (c)) 881
Amounts due from subsidiaries (Note 18(b)) 914,325
Cash and cash equivalents (Note 25) 259,559
1,174,765