Lenovo 2011 Annual Report Download - page 4
Download and view the complete annual report
Please find page 4 of the 2011 Lenovo annual report below. You can navigate through the pages in the report by either clicking on the pages listed below, or by using the keyword search tool below to find specific information within the annual report.-
 1
1 -
 2
2 -
 3
3 -
 4
4 -
 5
5 -
 6
6 -
 7
7 -
 8
8 -
 9
9 -
 10
10 -
 11
11 -
 12
12 -
 13
13 -
 14
14 -
 15
15 -
16
-
17
-
18
-
19
-
20
-
21
-
22
-
23
-
24
-
25
-
26
-
27
-
28
-
29
-
30
-
31
-
32
-
33
-
34
-
35
-
36
-
37
-
38
-
39
-
40
-
41
-
42
-
43
-
44
-
45
-
46
-
47
-
48
-
49
-
50
-
51
-
52
-
53
-
54
-
55
-
56
-
57
-
58
-
59
-
60
-
61
-
62
-
63
-
64
-
65
-
66
-
67
-
68
-
69
-
70
-
71
-
72
-
73
-
74
-
75
-
76
-
77
-
78
-
79
-
80
-
81
-
82
-
83
-
84
-
85
-
86
-
87
-
88
-
89
-
90
-
91
-
92
-
93
-
94
-
95
-
96
-
97
-
98
-
99
-
100
-
101
-
102
-
103
-
104
-
105
-
106
-
107
-
108
-
109
-
110
-
111
-
112
-
113
-
114
-
115
-
116
-
117
-
118
-
119
-
120
-
121
-
122
-
123
-
124
-
125
-
126
-
127
-
128
-
129
-
130
-
131
-
132
-
133
-
134
-
135
-
136
-
137
 |
 |

02 Financial Highlights
06 Chairman’s Statement
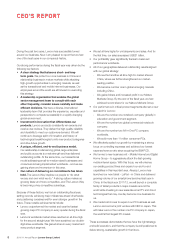
08 CEO’s Report
12 Lenovo Management Team
16 Management’s Discussion and Analysis
30 Corporate Governance
57 Directors’ Report
72 Independent Auditor’s Report
73 Consolidated Income Statement
74 Consolidated Statement of Comprehensive Income
75 Consolidated Balance Sheet
77 Balance Sheet
78 Consolidated Cash Flow Statement
79 Consolidated Statement of Changes in Equity
80 Notes to the Financial Statements
138 Five-Year Financial Summary
Inside Back Cover Corporate Information
FINANCIAL HIGHLIGHTS
For the year ended March 31
2011
US$ million
2010
US$ million
Year-on-year
Change
Group Results
Sales 21,594 16,605 30.0%
Gross profit 2,364 1,790 32.1%
Gross profit margin (%) 10.9 10.8 0.1 pt
Operating expenses1(1,978) (1,586) 24.7%
Expense-to-revenue ratio1 (%) 9.2 9.6 -0.4 pt
EBITDA1 603 432 39.6%
Pre-tax income1362 161 124.7%
Pre-tax income margin1 (%) 1.7 1.0 0.7 pt
Profit attributable to equity holders of the Company 273 129 111.2%
EPS – basic (US cents) 2.84 1.42 1.42
EPS – diluted (US cents) 2.73 1.33 1.40
Interim dividend per share (HK cents) 2.6 1.0 1.60
Final dividend per share (HK cents) 5.0 4.5 0.50
Total dividend per share (HK cents) 7.6 5.5 2.10
Cash and Working Capital
Bank deposits and cash and cash equivalents 2,997 2,439 22.9%
Total bank borrowings (272) (495) -45.1%
Net cash reserves 2,725 1,944 40.2%
Cash conversion cycle (days) (33) (30) (3)
Note:
1 Excluding restructuring charges, one-off charges and other income, net.
2010/11 Annual Report Lenovo Group Limited
2