Lenovo 2011 Annual Report Download - page 111
Download and view the complete annual report
Please find page 111 of the 2011 Lenovo annual report below. You can navigate through the pages in the report by either clicking on the pages listed below, or by using the keyword search tool below to find specific information within the annual report.-
 1
1 -
2
-
3
-
4
-
5
-
6
-
7
-
8
-
9
-
10
-
11
-
12
-
13
-
14
-
15
-
16
-
17
-
18
-
19
-
20
-
21
-
22
-
23
-
24
-
25
-
26
-
27
-
28
-
29
-
30
-
31
-
32
-
33
-
34
-
35
-
36
-
37
-
38
-
39
-
40
-
41
-
42
-
43
-
44
-
45
-
46
-
47
-
48
-
49
-
50
-
51
-
52
-
53
-
54
-
55
-
56
-
57
-
58
-
59
-
60
-
61
-
62
-
63
-
64
-
65
-
66
-
67
-
68
-
69
-
70
-
71
-
72
-
73
-
74
-
75
-
76
-
77
-
78
-
79
-
80
-
81
-
82
-
83
-
84
-
85
-
86
-
87
-
88
-
89
-
90
-
91
-
92
-
93
-
94
-
95
-
96
-
97
-
98
-
99
-
100
-
 101
101 -
 102
102 -
 103
103 -
 104
104 -
 105
105 -
 106
106 -
 107
107 -
 108
108 -
 109
109 -
 110
110 -
 111
111 -
 112
112 -
 113
113 -
 114
114 -
 115
115 -
 116
116 -
 117
117 -
 118
118 -
 119
119 -
 120
120 -
 121
121 -
122
-
123
-
124
-
125
-
126
-
127
-
128
-
129
-
130
-
131
-
132
-
133
-
134
-
135
-
136
-
137
 |
 |

2010/11 Annual Report Lenovo Group Limited
114
NOTES TO THE FINANCIAL STATEMENTS (continued)
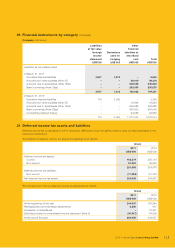
21 Deferred income tax assets and liabilities (continued)
(a) The movements in deferred income tax assets, analyzed by major component, during the year are as follows:
Provisions
and accruals Tax losses
Accelerated
accounting
depreciation
Deferred
revenue Total
US$’000 US$’000 US$’000 US$’000 US$’000
At April 1, 2009 122,036 19,519 3,823 45,466 190,844
Acquisition of subsidiaries 6,000 6,327 – – 12,327
Reclassification and exchange adjustment (11,624) 9,079 1,419 1,763 637
Credited/(debited) to consolidated
income statement 21,595 (11,025) 4,191 36,409 51,170
At March 31, 2010 and April 1, 2010 138,007 23,900 9,433 83,638 254,978
Reclassification and exchange adjustment (1,003) (3,741) 432 10,753 6,441
Credited/(debited) to consolidated
income statement 13,416 5,297 (1,735) (27,299) (10,321)
At March 31, 2011 150,420 25,456 8,130 67,092 251,098
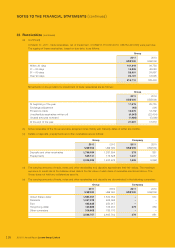
Deferred income tax assets are recognized for deductible temporary differences and tax losses carried forward to the
extent that realization of the related tax benefit through the future taxable profits is probable. At March 31, 2011, the
Group did not recognize deferred income tax assets in respect of tax losses of approximately US$751,904,000 (2010:
US$849,311,000) that can be carried forward against future taxable income, of which, tax losses of US$659,254,000
(2010: US$737,480,000) can be carried forward indefinitely. The remaining balances of tax losses will expire as follows:
Group
2011 2010
US$’000 US$’000
Expiring in
– 2014 16,263 6,556
– 2015 7,146 52,582
– 2016 5,616 10,392
– 2017 42,098 42,301
– 2018 13,108 –
– 2019 8,419 –
92,650 111,831
(b) The movements in deferred income tax liabilities, analyzed by major component, during the year are as follows:
Accelerated
tax
depreciation
Undistributed
earnings Total
US$’000 US$’000 US$’000
At April 1, 2009 –––
Debited to consolidated income statement –10,331 10,331
At March 31, 2010 and April 1, 2010 –10,331 10,331
Exchange adjustment 8128 136
Debited to consolidated income statement 475 6,151 6,626
At March 31, 2011 483 16,610 17,093