Lenovo 2011 Annual Report Download - page 114
Download and view the complete annual report
Please find page 114 of the 2011 Lenovo annual report below. You can navigate through the pages in the report by either clicking on the pages listed below, or by using the keyword search tool below to find specific information within the annual report.-
 1
1 -
2
-
3
-
4
-
5
-
6
-
7
-
8
-
9
-
10
-
11
-
12
-
13
-
14
-
15
-
16
-
17
-
18
-
19
-
20
-
21
-
22
-
23
-
24
-
25
-
26
-
27
-
28
-
29
-
30
-
31
-
32
-
33
-
34
-
35
-
36
-
37
-
38
-
39
-
40
-
41
-
42
-
43
-
44
-
45
-
46
-
47
-
48
-
49
-
50
-
51
-
52
-
53
-
54
-
55
-
56
-
57
-
58
-
59
-
60
-
61
-
62
-
63
-
64
-
65
-
66
-
67
-
68
-
69
-
70
-
71
-
72
-
73
-
74
-
75
-
76
-
77
-
78
-
79
-
80
-
81
-
82
-
83
-
84
-
85
-
86
-
87
-
88
-
89
-
90
-
91
-
92
-
93
-
94
-
95
-
96
-
97
-
98
-
99
-
100
-
101
-
102
-
103
-
 104
104 -
 105
105 -
 106
106 -
 107
107 -
 108
108 -
 109
109 -
 110
110 -
 111
111 -
 112
112 -
 113
113 -
 114
114 -
 115
115 -
 116
116 -
 117
117 -
 118
118 -
 119
119 -
 120
120 -
 121
121 -
 122
122 -
 123
123 -
 124
124 -
125
-
126
-
127
-
128
-
129
-
130
-
131
-
132
-
133
-
134
-
135
-
136
-
137
 |
 |

2010/11 Annual Report Lenovo Group Limited 117
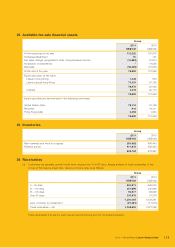
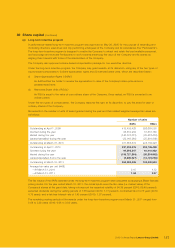
25 Bank deposits and cash and cash equivalents
Group Company
2011 2010 2011 2010
US$’000 US$’000 US$’000 US$’000
Bank deposits
– matured between three to six months 22,158 172,126 ––
– restricted bank balances 20,000 28,330 20,000 –
42,158 200,456 20,000 –
Cash and cash equivalents
– cash at bank and in hand 2,222,317 1,707,766 25,955 79,559
– money market funds 732,181 530,429 –180,000
2,954,498 2,238,195 25,955 259,559
2,996,656 2,438,651 45,955 259,559
Maximum exposure to credit risk 2,996,656 2,438,651 45,955 259,559
Bank deposits and cash and cash equivalents are denominated in the following currencies:
Group Company
2011 2010 2011 2010
US$’000 US$’000 US$’000 US$’000
United States dollar 1,615,329 1,046,513 45,510 254,022
Renminbi 1,110,373 1,137,606 46 –
Euro 21,633 38,602 –44
Japanese Yen 12,863 3,827 ––
Other currencies 236,458 212,103 399 5,493
2,996,656 2,438,651 45,955 259,559
The effective annual interest rates for bank deposits and cash and cash equivalents of the Group and of the Company at
March 31, 2011 ranged from 0% to 12.01% (2010: 0% to 9.02%) per annum and from 0% to 0.21% (2010: 0% to 0.67%)
per annum respectively.
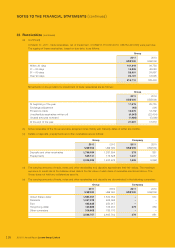
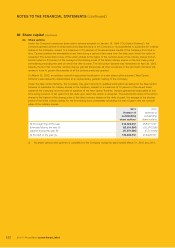
26 Payables
(a) Ageing analysis of trade payables of the Group at the balance sheet date, based on invoice date, is as follows:
Group
2011 2010
US$’000 US$’000
0 – 30 days 1,381,832 2,425,237
31 – 60 days 503,648 609,720
61 – 90 days 230,791 74,499
Over 90 days 63,568 31,970
2,179,839 3,141,426
Trade payables are denominated in the following currencies:
Group
2011 2010
US$’000 US$’000
United States dollar 1,348,334 2,504,068
Renminbi 551,847 276,183
Euro 23,851 38,736
Hong Kong dollar 181,589 284,624
Other currencies 74,218 37,815
2,179,839 3,141,426
(b) Notes payable of the Group are mainly repayable within three months.
(c) The carrying amounts of trade payables and notes payable approximate their fair value.