Lenovo 2011 Annual Report Download - page 75
Download and view the complete annual report
Please find page 75 of the 2011 Lenovo annual report below. You can navigate through the pages in the report by either clicking on the pages listed below, or by using the keyword search tool below to find specific information within the annual report.-
 1
1 -
2
-
3
-
4
-
5
-
6
-
7
-
8
-
9
-
10
-
11
-
12
-
13
-
14
-
15
-
16
-
17
-
18
-
19
-
20
-
21
-
22
-
23
-
24
-
25
-
26
-
27
-
28
-
29
-
30
-
31
-
32
-
33
-
34
-
35
-
36
-
37
-
38
-
39
-
40
-
41
-
42
-
43
-
44
-
45
-
46
-
47
-
48
-
49
-
50
-
51
-
52
-
53
-
54
-
55
-
56
-
57
-
58
-
59
-
60
-
61
-
62
-
63
-
64
-
 65
65 -
 66
66 -
 67
67 -
 68
68 -
 69
69 -
 70
70 -
 71
71 -
 72
72 -
 73
73 -
 74
74 -
 75
75 -
 76
76 -
 77
77 -
 78
78 -
 79
79 -
 80
80 -
 81
81 -
 82
82 -
 83
83 -
 84
84 -
 85
85 -
86
-
87
-
88
-
89
-
90
-
91
-
92
-
93
-
94
-
95
-
96
-
97
-
98
-
99
-
100
-
101
-
102
-
103
-
104
-
105
-
106
-
107
-
108
-
109
-
110
-
111
-
112
-
113
-
114
-
115
-
116
-
117
-
118
-
119
-
120
-
121
-
122
-
123
-
124
-
125
-
126
-
127
-
128
-
129
-
130
-
131
-
132
-
133
-
134
-
135
-
136
-
137
 |
 |

2010/11 Annual Report Lenovo Group Limited
78
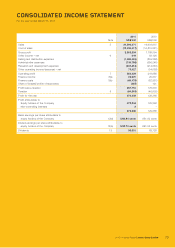
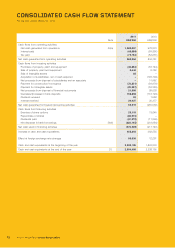
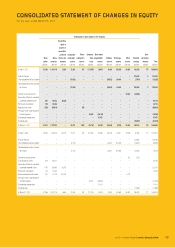
CONSOLIDATED CASH FLOW STATEMENT
For the year ended March 31, 2011
2011 2010
Note US$’000 US$’000
Cash flows from operating activities
Net cash generated from operations 36(a) 1,089,097 976,873
Interest paid (48,089) (59,891)
Tax paid (75,754) (82,231)
Net cash generated from operating activities 965,254 834,751
Cash flows from investing activities
Purchase of property, plant and equipment (48,834) (36,144)
Sale of property, plant and equipment 8,440 8,762
Sale of intangible assets 25 –
Acquisition of subsidiaries, net of cash acquired –(106,704)
Net proceeds from disposal of subsidiaries and an associate –11,982
Payment for construction-in-progress (78,531) (39,979)
Payment for intangible assets (20,297) (32,320)
Net proceeds from disposal of financial instruments 21,398 89,538
Decrease/(increase) in bank deposits 158,298 (172,126)
Dividend received 93 1,558
Interest received 24,927 20,377
Net cash generated from/(used in)investing activities 65,519 (255,056)
Cash flows from financing activities
Exercise of share options 25,116 13,640
Repurchase of shares (86,610) –
Dividends paid (87,870) (11,896)
Net decrease in bank borrowings 36(b) (223,145) (218,884)
Net cash used in financing activities (372,509) (217,140)
Increase in cash and cash equivalents 658,264 362,555
Effect of foreign exchange rate changes 58,039 12,261
Cash and cash equivalents at the beginning of the year 2,238,195 1,863,379
Cash and cash equivalents at the end of the year 25 2,954,498 2,238,195