Lenovo 2011 Annual Report Download - page 122
Download and view the complete annual report
Please find page 122 of the 2011 Lenovo annual report below. You can navigate through the pages in the report by either clicking on the pages listed below, or by using the keyword search tool below to find specific information within the annual report.-
 1
1 -
2
-
3
-
4
-
5
-
6
-
7
-
8
-
9
-
10
-
11
-
12
-
13
-
14
-
15
-
16
-
17
-
18
-
19
-
20
-
21
-
22
-
23
-
24
-
25
-
26
-
27
-
28
-
29
-
30
-
31
-
32
-
33
-
34
-
35
-
36
-
37
-
38
-
39
-
40
-
41
-
42
-
43
-
44
-
45
-
46
-
47
-
48
-
49
-
50
-
51
-
52
-
53
-
54
-
55
-
56
-
57
-
58
-
59
-
60
-
61
-
62
-
63
-
64
-
65
-
66
-
67
-
68
-
69
-
70
-
71
-
72
-
73
-
74
-
75
-
76
-
77
-
78
-
79
-
80
-
81
-
82
-
83
-
84
-
85
-
86
-
87
-
88
-
89
-
90
-
91
-
92
-
93
-
94
-
95
-
96
-
97
-
98
-
99
-
100
-
101
-
102
-
103
-
104
-
105
-
106
-
107
-
108
-
109
-
110
-
111
-
 112
112 -
 113
113 -
 114
114 -
 115
115 -
 116
116 -
 117
117 -
 118
118 -
 119
119 -
 120
120 -
 121
121 -
 122
122 -
 123
123 -
 124
124 -
 125
125 -
 126
126 -
 127
127 -
 128
128 -
 129
129 -
 130
130 -
 131
131 -
 132
132 -
133
-
134
-
135
-
136
-
137
 |
 |

2010/11 Annual Report Lenovo Group Limited 125
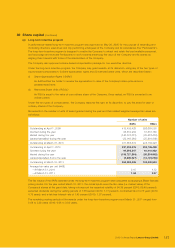
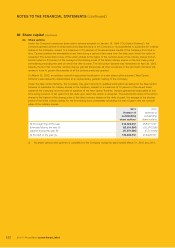
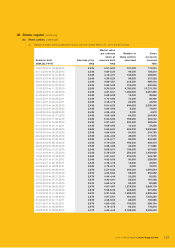
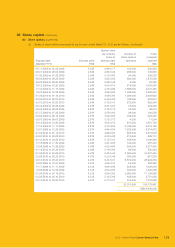
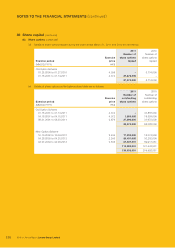
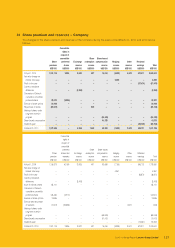
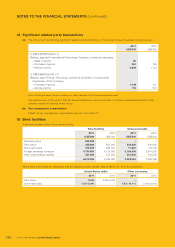
30 Share capital (continued)
(b) Share options (continued)
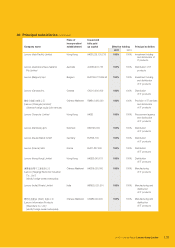
(ii) Details of share options exercised during the year ended March 31, 2010 are as follows: (continued)
Exercise date Exercise price
Market value
per ordinary
share at
exercise date
Number of
share options
exercised
Gross
proceeds
received
(MM.DD.YYYY) HK$ HK$ HK$
05.11.2009 to 05.25.2009 2.545 2.86-3.17 130,000 330,850
06.01.2009 to 06.08.2009 2.545 2.86-3.29 288,000 732,960
07.20.2009 to 07.28.2009 2.545 3.15-3.60 94,000 239,230
08.04.2009 to 08.25.2009 2.545 3.62-3.93 500,000 1,272,500
09.29.2009 to 09.29.2009 2.545 3.48-3.48 8,000 20,360
10.12.2009 to 10.20.2009 2.545 4.03-4.70 414,000 1,053,630
11.10.2009 to 11.17.2009 2.545 4.15-4.69 1,588,000 4,041,460
12.07.2009 to 12.28.2009 2.545 4.26-4.84 1,046,000 2,662,070
01.04.2010 to 01.14.2010 2.545 4.99-5.90 1,036,000 2,636,620
02.02.2010 to 02.03.2010 2.545 5.40-5.68 198,000 503,910
03.10.2010 to 03.23.2010 2.545 5.12-5.41 272,000 692,240
05.19.2009 to 05.26.2009 2.876 2.87-3.03 78,000 224,328
06.02.2009 to 06.02.2009 2.876 3.12-3.12 16,000 46,016
07.27.2009 to 07.28.2009 2.876 3.59-3.60 36,000 103,536
08.04.2009 to 08.18.2009 2.876 3.59-3.93 182,000 523,432
09.07.2009 to 09.07.2009 2.876 3.72-3.72 4,000 11,504
10.12.2009 to 10.20.2009 2.876 4.03-4.70 470,000 1,351,720
11.10.2009 to 11.17.2009 2.876 4.15-4.69 3,136,000 9,019,136
12.01.2009 to 12.28.2009 2.876 4.45-4.84 1,222,000 3,514,472
01.04.2010 to 01.14.2010 2.876 4.99-5.90 826,000 2,375,576
02.03.2010 to 02.08.2010 2.876 5.23-5.68 212,000 609,712
03.10.2010 to 03.23.2010 2.876 5.12-5.41 348,000 1,000,848
11.16.2009 to 11.30.2009 4.038 4.47-4.68 144,000 581,472
12.08.2009 to 12.29.2009 4.038 4.50-4.85 564,000 2,277,432
01.14.2010 to 01.26.2010 4.038 5.19-5.90 88,000 355,344
01.06.2010 to 01.06.2010 4.072 5.43-5.43 2,520,000 10,261,440
02.08.2010 to 02.23.2010 4.072 5.23-5.49 160,000 651,520
03.10.2010 to 03.22.2010 4.072 5.27-5.41 6,612,000 26,924,064
10.20.2009 to 10.27.2009 4.312 4.52-4.70 54,000 232,848
11.17.2009 to 11.17.2009 4.312 4.69-4.69 238,000 1,026,256
12.08.2009 to 12.28.2009 4.312 4.50-4.84 334,000 1,440,208
01.04.2010 to 01.14.2010 4.312 4.99-5.90 2,580,000 11,124,960
02.03.2010 to 02.10.2010 4.312 5.12-5.68 638,000 2,751,056
03.10.2010 to 03.24.2010 4.312 5.17-5.41 319,000 1,375,528
32,370,500 105,778,461
US$13,640,000