Lenovo 2011 Annual Report Download - page 92
Download and view the complete annual report
Please find page 92 of the 2011 Lenovo annual report below. You can navigate through the pages in the report by either clicking on the pages listed below, or by using the keyword search tool below to find specific information within the annual report.-
 1
1 -
2
-
3
-
4
-
5
-
6
-
7
-
8
-
9
-
10
-
11
-
12
-
13
-
14
-
15
-
16
-
17
-
18
-
19
-
20
-
21
-
22
-
23
-
24
-
25
-
26
-
27
-
28
-
29
-
30
-
31
-
32
-
33
-
34
-
35
-
36
-
37
-
38
-
39
-
40
-
41
-
42
-
43
-
44
-
45
-
46
-
47
-
48
-
49
-
50
-
51
-
52
-
53
-
54
-
55
-
56
-
57
-
58
-
59
-
60
-
61
-
62
-
63
-
64
-
65
-
66
-
67
-
68
-
69
-
70
-
71
-
72
-
73
-
74
-
75
-
76
-
77
-
78
-
79
-
80
-
81
-
 82
82 -
 83
83 -
 84
84 -
 85
85 -
 86
86 -
 87
87 -
 88
88 -
 89
89 -
 90
90 -
 91
91 -
 92
92 -
 93
93 -
 94
94 -
 95
95 -
 96
96 -
 97
97 -
 98
98 -
 99
99 -
 100
100 -
 101
101 -
 102
102 -
103
-
104
-
105
-
106
-
107
-
108
-
109
-
110
-
111
-
112
-
113
-
114
-
115
-
116
-
117
-
118
-
119
-
120
-
121
-
122
-
123
-
124
-
125
-
126
-
127
-
128
-
129
-
130
-
131
-
132
-
133
-
134
-
135
-
136
-
137
 |
 |

2010/11 Annual Report Lenovo Group Limited 95
3 Financial risk management (continued)
(b) Market risks sensitivity analysis (continued)
(ii) Interest rate sensitivity analysis
Cash flow interest rate risk on United States dollar-denominated long-term borrowings is mitigated through the use
of floating-to-fixed interest rate swaps as hedges. Borrowings in other currencies are insignificant. Accordingly, no
interest rate sensitivity analysis on borrowings is presented.
At March 31, 2011, if interest rates on the global channel financing program had been 25 basis points higher/
lower with all other variables held constant, post-tax profit for the year would have been US$1.32 million (2010:
US$0.97 million) lower/higher. This analysis is based on the assumption that the interest rates of all the currencies
covered by the global channel financing program go up and down at the same time and with the same magnitude;
however, such assumptions may not be necessarily true in reality.
(c) Capital risks management
The Group’s objectives when managing capital are to safeguard the Group’s ability to continue as a going concern in
order to provide returns for shareholders and benefits for other stakeholders and to maintain an optimal capital structure
to reduce the cost of capital.
In order to maintain or adjust the capital structure, the Group may adjust the amount of dividends paid to shareholders,
return capital to shareholders, issue new shares or sell assets to reduce debt.
Consistent with others in the industry, the Group monitors capital on the basis of gearing ratio. This ratio is calculated
as total borrowings (including current and non-current borrowings) divided by total equity. The Group’s strategy remains
unchanged and the gearing ratios and net cash position of the Group as at March 31, 2011 and 2010 are as follows:
2011 2010
US$ million US$ million
Bank deposits and cash and cash equivalents (Note 25) 2,997 2,439
Less: total borrowings (272) (495)
Net cash position 2,725 1,944
Total equity 1,835 1,606
Gearing ratio 0.15 0.31
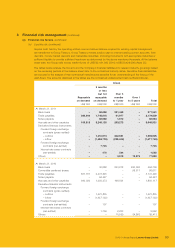
(d) Fair value estimation
The table below analyzes financial instruments carried at fair value, by valuation method. The different levels have been
defined as follows:
–Level 1 Quoted prices (unadjusted) in active markets for identical assets or liabilities
–Level 2 Inputs other than quoted prices included within level 1 that are observable for the asset or liability, either
directly (that is, as prices) or indirectly (that is, derived from prices)
–Level 3 Inputs for the asset or liability that are not based on observable market data (that is, unobservable
inputs)
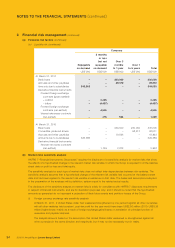
The fair value of financial instruments traded in active markets is based on quoted market prices at the balance sheet
date. A market is regarded as active if quoted prices are readily and regularly available from an exchange, dealer, broker,
industry group, pricing service, or regulatory agency, and those prices represent actual and regularly occurring market
transactions on an arm’s length basis. The quoted market price used for financial assets held by the Group is the
current bid price. These instruments are included in Level 1.
The fair value of financial instruments that are not traded in an active market (for example, over-the-counter derivatives)
is determined by using valuation techniques. These valuation techniques maximize the use of observable market data
where it is available and rely as little as possible on entity specific estimates. If all significant inputs required to fair value
an instrument are observable, the instrument is included in Level 2.
If one or more of the significant inputs is not based on observable market data, the instrument is included in Level 3.