Lenovo 2011 Annual Report Download - page 115
Download and view the complete annual report
Please find page 115 of the 2011 Lenovo annual report below. You can navigate through the pages in the report by either clicking on the pages listed below, or by using the keyword search tool below to find specific information within the annual report.-
 1
1 -
2
-
3
-
4
-
5
-
6
-
7
-
8
-
9
-
10
-
11
-
12
-
13
-
14
-
15
-
16
-
17
-
18
-
19
-
20
-
21
-
22
-
23
-
24
-
25
-
26
-
27
-
28
-
29
-
30
-
31
-
32
-
33
-
34
-
35
-
36
-
37
-
38
-
39
-
40
-
41
-
42
-
43
-
44
-
45
-
46
-
47
-
48
-
49
-
50
-
51
-
52
-
53
-
54
-
55
-
56
-
57
-
58
-
59
-
60
-
61
-
62
-
63
-
64
-
65
-
66
-
67
-
68
-
69
-
70
-
71
-
72
-
73
-
74
-
75
-
76
-
77
-
78
-
79
-
80
-
81
-
82
-
83
-
84
-
85
-
86
-
87
-
88
-
89
-
90
-
91
-
92
-
93
-
94
-
95
-
96
-
97
-
98
-
99
-
100
-
101
-
102
-
103
-
104
-
 105
105 -
 106
106 -
 107
107 -
 108
108 -
 109
109 -
 110
110 -
 111
111 -
 112
112 -
 113
113 -
 114
114 -
 115
115 -
 116
116 -
 117
117 -
 118
118 -
 119
119 -
 120
120 -
 121
121 -
 122
122 -
 123
123 -
 124
124 -
 125
125 -
126
-
127
-
128
-
129
-
130
-
131
-
132
-
133
-
134
-
135
-
136
-
137
 |
 |

2010/11 Annual Report Lenovo Group Limited
118
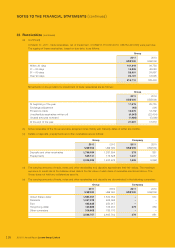
NOTES TO THE FINANCIAL STATEMENTS (continued)
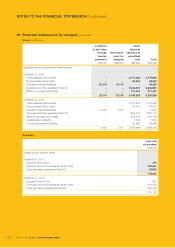
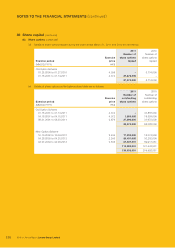
27 Provisions, accruals and other payables
Details of provisions, accruals and other payables are as follows:
Group Company
2011 2010 2011 2010
US$’000 US$’000 US$’000 US$’000
Provisions 307,900 260,796 ––
Accruals 904,219 659,212 18,817 9,765
Provision for billing adjustments 1,139,828 474,937 ––
Other payables 2,744,702 1,190,905 20,502 10,083
5,096,649 2,585,850 39,319 19,848
The carrying amounts of accruals and other payables approximate their fair value.
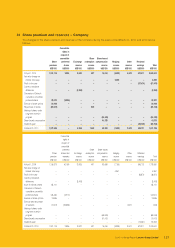
Provisions include warranty and restructuring provisions as follows:
Group
Warranty Restructuring Total
US$’000 US$’000 US$’000
Year ended March 31, 2010
At the beginning of the year 533,399 97,603 631,002
Exchange adjustment (2,739) 2,673 (66)
Provisions made 480,402 6,631 487,033
Acquisition of subsidiaries 4,701 –4,701
Amounts utilized (451,065) (81,943) (533,008)
Unused amounts reversed (14,009) (13,623) (27,632)
550,689 11,341 562,030
Long-term portion classified as non-current liabilities (301,234) –(301,234)
At the end of the year 249,455 11,341 260,796
Year ended March 31, 2011
At the beginning of the year 550,689 11,341 562,030
Exchange adjustment 11,310 84 11,394
Provisions made 644,778 3,126 647,904
Amounts utilized (510,054) (3,585) (513,639)
Unused amounts reversed (2,000) (2,547) (4,547)
694,723 8,419 703,142
Long-term portion classified as non-current liabilities (395,242) –(395,242)
At the end of the year 299,481 8,419 307,900
The Group records its warranty liability at the time of sales based on estimated costs. Warranty claims are reasonably
predictable based on historical failure rate information. The warranty accrual is reviewed quarterly to verify it properly reflects
the outstanding obligation over the warranty period. Certain of these costs are reimbursable from the suppliers in accordance
with the terms of relevant arrangement with the suppliers.