Lenovo 2011 Annual Report Download - page 95
Download and view the complete annual report
Please find page 95 of the 2011 Lenovo annual report below. You can navigate through the pages in the report by either clicking on the pages listed below, or by using the keyword search tool below to find specific information within the annual report.-
 1
1 -
2
-
3
-
4
-
5
-
6
-
7
-
8
-
9
-
10
-
11
-
12
-
13
-
14
-
15
-
16
-
17
-
18
-
19
-
20
-
21
-
22
-
23
-
24
-
25
-
26
-
27
-
28
-
29
-
30
-
31
-
32
-
33
-
34
-
35
-
36
-
37
-
38
-
39
-
40
-
41
-
42
-
43
-
44
-
45
-
46
-
47
-
48
-
49
-
50
-
51
-
52
-
53
-
54
-
55
-
56
-
57
-
58
-
59
-
60
-
61
-
62
-
63
-
64
-
65
-
66
-
67
-
68
-
69
-
70
-
71
-
72
-
73
-
74
-
75
-
76
-
77
-
78
-
79
-
80
-
81
-
82
-
83
-
84
-
 85
85 -
 86
86 -
 87
87 -
 88
88 -
 89
89 -
 90
90 -
 91
91 -
 92
92 -
 93
93 -
 94
94 -
 95
95 -
 96
96 -
 97
97 -
 98
98 -
 99
99 -
 100
100 -
 101
101 -
 102
102 -
 103
103 -
 104
104 -
 105
105 -
106
-
107
-
108
-
109
-
110
-
111
-
112
-
113
-
114
-
115
-
116
-
117
-
118
-
119
-
120
-
121
-
122
-
123
-
124
-
125
-
126
-
127
-
128
-
129
-
130
-
131
-
132
-
133
-
134
-
135
-
136
-
137
 |
 |

2010/11 Annual Report Lenovo Group Limited
98
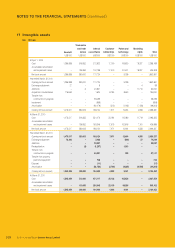
NOTES TO THE FINANCIAL STATEMENTS (continued)
4 Critical accounting estimates and judgments (continued)
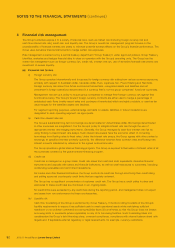
(d) Revenue recognition (continued)
The Group sells products to channels. Sales through channels are primarily made under agreements allowing for limited
rights of sales return, volume discounts, price protection and rebates, and marketing development funds. The Group’s
policy for sales to channels is to defer, until the return period is over, the full amount of revenue relative to sales for
which the rights of return apply unless there is sufficient historical data to establish reasonable and reliable estimates
of customer returns which include estimated return rates as well as the number of units shipped that still have a right
of return as of the balance sheet date. Revenue recognition is also impacted by the Group’s ability to estimate volume
discounts, price protection and rebates, and marketing development funds. The Group considers various factors,
including a review of specific transactions, historical experience and market and economic conditions when calculating
these provisions and allowances.
Revenue from sales of goods is recognized when both ownership and risk of loss are effectively transferred to customer.
Risk of loss associated with goods-in-transit is generally retained by the Group. The Group books revenue upon delivery
of products, and defers the amounts of revenue based on the estimated days-in-transit at the end of each month. The
days-in-transit is estimated based on the Group’s weighted average estimated time of shipment arrival. Cost of in-transit
products is deferred in deposits, prepayment and other receivables in the balance sheet until revenue is recognized. The
estimates of days-in-transit are reviewed semi-annually.
(e) Retirement benefits
Pension and other post-retirement benefit costs and obligations are dependent on various assumptions. The Group’s
major assumptions primarily relate to discount rate, expected return on assets, and salary growth. In determining the
discount rate, the Group references market yields at the balance sheet date on high quality corporate bonds. The
currency and term of the bonds are consistent with the currency and estimated term of the benefit obligations being
valued. The expected return on plan assets is based on market expectations for returns over the life of the related
assets and obligations. The salary growth assumptions reflect the Group’s long-term actual experience and future and
near-term outlook. Actual results that differ from the assumptions are generally recognized in the year they occur.
(f) Fair value of derivatives and other financial instruments
The fair value of financial instruments that are not traded in an active market (for example, over-the-counter derivatives)
is determined by using valuation techniques. The Group uses its judgment to select a variety of methods and make
assumptions that are mainly based on market conditions existing at each balance sheet date. The Group has used
discounted cash flow analysis for various available-for-sale financial assets that are not traded in active markets.
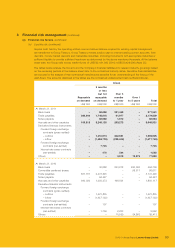
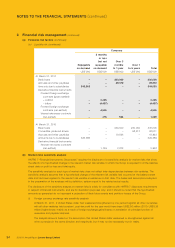
5 Segment information
Management has determined the operating segments based on the reports reviewed by the Lenovo Executive Committee (the
“LEC”), the chief operating decision-maker, that are used to make strategic decisions.
The LEC considers business from a market perspective. The Group has three market segments, China, emerging markets
(excluding China) and mature markets, which are also the Group’s reportable operating segments.
The LEC assesses the performance of the operating segments based on a measure of adjusted pre-tax income/(loss).
This measurement basis excludes the effects of non-recurring expenditure such as restructuring costs from the operating
segments. The measurement basis also excludes the effects of unrealized gains/losses on financial instruments. Interest
income and expenditure are not allocated to segments, as this type of activity is driven by the central treasury function, which
manages the cash position of the Group.
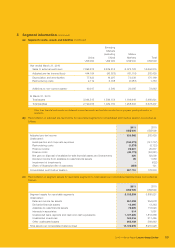
(a) Segment results, assets and liabilities
The segment information provided to the LEC for the reportable segments are as follows:
China
Emerging
Markets
(excluding
China)
Mature
Markets Total
US$’000 US$’000 US$’000 US$’000
Year ended March 31, 2011
Sales to external customers 10,015,371 3,859,739 7,719,261 21,594,371
Adjusted pre-tax income/(loss) 507,497 (64,669) 77,734 520,562
Depreciation and amortization 71,380 22,017 82,743 176,140
Restructuring costs –(51) 398 347
Additions to non-current assets* 46,256 6,305 15,510 68,071
At March 31, 2011
Total assets 4,029,553 2,768,369 1,387,477 8,185,399
Total liabilities 3,036,757 2,789,863 1,564,411 7,391,031