Lenovo 2011 Annual Report Download - page 20
Download and view the complete annual report
Please find page 20 of the 2011 Lenovo annual report below. You can navigate through the pages in the report by either clicking on the pages listed below, or by using the keyword search tool below to find specific information within the annual report.-
 1
1 -
2
-
3
-
4
-
5
-
6
-
7
-
8
-
9
-
 10
10 -
 11
11 -
 12
12 -
 13
13 -
 14
14 -
 15
15 -
 16
16 -
 17
17 -
 18
18 -
 19
19 -
 20
20 -
 21
21 -
 22
22 -
 23
23 -
 24
24 -
 25
25 -
 26
26 -
 27
27 -
 28
28 -
 29
29 -
 30
30 -
31
-
32
-
33
-
34
-
35
-
36
-
37
-
38
-
39
-
40
-
41
-
42
-
43
-
44
-
45
-
46
-
47
-
48
-
49
-
50
-
51
-
52
-
53
-
54
-
55
-
56
-
57
-
58
-
59
-
60
-
61
-
62
-
63
-
64
-
65
-
66
-
67
-
68
-
69
-
70
-
71
-
72
-
73
-
74
-
75
-
76
-
77
-
78
-
79
-
80
-
81
-
82
-
83
-
84
-
85
-
86
-
87
-
88
-
89
-
90
-
91
-
92
-
93
-
94
-
95
-
96
-
97
-
98
-
99
-
100
-
101
-
102
-
103
-
104
-
105
-
106
-
107
-
108
-
109
-
110
-
111
-
112
-
113
-
114
-
115
-
116
-
117
-
118
-
119
-
120
-
121
-
122
-
123
-
124
-
125
-
126
-
127
-
128
-
129
-
130
-
131
-
132
-
133
-
134
-
135
-
136
-
137
 |
 |

MANAGEMENT’S DISCUSSION & ANALYSIS
2010/11 Annual Report Lenovo Group Limited
22
FINANCIAL REVIEW
FINANCIAL HIGHLIGHTS
For the year ended Mach 31
2011
US$’000
2010
US$’000
Sales 21,594,371 16,604,815
EBITDA1603,202 431,806
Profit attributable to equity holders of the Company 273,234 129,368
Earnings per share (US cents)
– Basic 2.84 1.42
– Diluted 2.73 1.33
Dividend per ordinary share (HK cents)
– Interim dividend 2.6 1.0
– Proposed final dividend 5.0 4.5
RESULTS
For the year ended March 31, 2011, the Group achieved total sales of approximately US$21,594 million. Profit attributable to equity
holders for the year was approximately US$273 million, representing an increase of US$144 million as compared with last year.
Gross profit margin for the year was 0.1 percent point up from 10.8 percent reported in the last year. The balance sheet position
remained strong, bank deposits and cash and cash equivalents increased by US$558 million as compared to March 31, 2010.
Basic earnings per share and diluted earnings per share were US2.84 cents and US2.73 cents, representing an increase of US1.42
cents and US1.40 cents respectively as compared with last year.
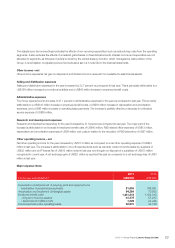
The Group adopts market segments as the reporting format. Market segments comprise China, Emerging Markets (excluding
China) and Mature Markets. Further analyses on segment performance are set out in Business Review.
2011 2010
For the year ended March 31
Sales to
external
customers
US$’000
Adjusted
pre-tax
income/(loss)
US$’000
Sales to
external
customers
US$’000
Adjusted
pre-tax
income/(loss)
US$’000
China 10,015,371 507,497 7,892,275 444,164
Emerging Markets (excluding China) 3,859,739 (64,669) 2,639,812 (96,625)
Mature Markets 7,719,261 77,734 6,072,728 (65,119)
21,594,371 520,562 16,604,815 282,420
Notes:
1 Excluding restructuring charges, one-off charges and other income, net.