Lenovo 2011 Annual Report Download - page 90
Download and view the complete annual report
Please find page 90 of the 2011 Lenovo annual report below. You can navigate through the pages in the report by either clicking on the pages listed below, or by using the keyword search tool below to find specific information within the annual report.-
 1
1 -
2
-
3
-
4
-
5
-
6
-
7
-
8
-
9
-
10
-
11
-
12
-
13
-
14
-
15
-
16
-
17
-
18
-
19
-
20
-
21
-
22
-
23
-
24
-
25
-
26
-
27
-
28
-
29
-
30
-
31
-
32
-
33
-
34
-
35
-
36
-
37
-
38
-
39
-
40
-
41
-
42
-
43
-
44
-
45
-
46
-
47
-
48
-
49
-
50
-
51
-
52
-
53
-
54
-
55
-
56
-
57
-
58
-
59
-
60
-
61
-
62
-
63
-
64
-
65
-
66
-
67
-
68
-
69
-
70
-
71
-
72
-
73
-
74
-
75
-
76
-
77
-
78
-
79
-
 80
80 -
 81
81 -
 82
82 -
 83
83 -
 84
84 -
 85
85 -
 86
86 -
 87
87 -
 88
88 -
 89
89 -
 90
90 -
 91
91 -
 92
92 -
 93
93 -
 94
94 -
 95
95 -
 96
96 -
 97
97 -
 98
98 -
 99
99 -
 100
100 -
101
-
102
-
103
-
104
-
105
-
106
-
107
-
108
-
109
-
110
-
111
-
112
-
113
-
114
-
115
-
116
-
117
-
118
-
119
-
120
-
121
-
122
-
123
-
124
-
125
-
126
-
127
-
128
-
129
-
130
-
131
-
132
-
133
-
134
-
135
-
136
-
137
 |
 |

2010/11 Annual Report Lenovo Group Limited 93
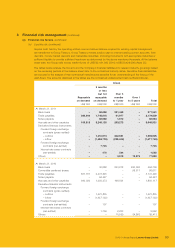
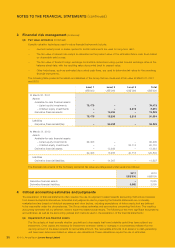
3 Financial risk management (continued)
(a) Financial risk factors (continued)
(iv) Liquidity risk (continued)
Surplus cash held by the operating entities over and above balance required for working capital management
are transferred to Group Treasury. Group Treasury invests surplus cash in interest bearing current accounts, time
deposits, money market deposits and marketable securities, choosing instruments with appropriate maturities or
sufficient liquidity to provide sufficient headroom as determined by the above-mentioned forecasts, At the balance
sheet date, the Group held money market funds of US$732,181,000 (2010: US$530,429,000) (Note 25).
The tables below analyze the Group’s and the Company’s financial liabilities into relevant maturity groupings based
on the remaining periods at the balance sheet date to the contractual maturity dates. Derivative financial liabilities
are included in the analysis if their contractual maturities are essential for an understanding of the timing of the
cash flows. The amounts disclosed in the tables are the contractual undiscounted cash outflows/(inflows).
Group
Repayable
on demand
3 months
or less
but not
repayable
on demand
Over 3
months
to 1 year
Over 1
to 5 years Total
US$’000 US$’000 US$’000 US$’000 US$’000
At March 31, 2011
Bank loans –50,098 221,463 –271,561
Trade payables 369,244 1,748,618 61,977 –2,179,839
Notes payable –96,992 1,972 –98,964
Accruals and other payables 109,513 3,246,135 293,273 –3,648,921
Derivative financial instruments
Forward foreign exchange
contracts (gross-settled)
– outflow –1,451,974 242,931 –1,694,905
– inflow –(1,438,703) (239,040) –(1,677,743)
Forward foreign exchange
contracts (net-settled) –7,725 – – 7,725
Interest rate swap contracts
(net-settled) –476 544 –1,020
Others – – 3,913 73,976 77,889
At March 31, 2010
Bank loans –30,888 263,818 200,000 494,706
Convertible preferred shares – – – 98,611 98,611
Trade payables 667,781 2,473,645 – – 3,141,426
Notes payable –94,427 – – 94,427
Accruals and other payables 360,020 1,293,273 196,824 –1,850,117
Derivative financial instruments
Forward foreign exchange
contracts (gross-settled)
– outflow –1,421,835 – – 1,421,835
– inflow –(1,427,122) – – (1,427,122)
Forward foreign exchange
contracts (net-settled) –107 – – 107
Interest rate swap contracts
(net-settled) –1,759 2,203 –3,962
Others – – 10,550 24,863 35,413