Lenovo 2011 Annual Report Download - page 38
Download and view the complete annual report
Please find page 38 of the 2011 Lenovo annual report below. You can navigate through the pages in the report by either clicking on the pages listed below, or by using the keyword search tool below to find specific information within the annual report.-
 1
1 -
2
-
3
-
4
-
5
-
6
-
7
-
8
-
9
-
10
-
11
-
12
-
13
-
14
-
15
-
16
-
17
-
18
-
19
-
20
-
21
-
22
-
23
-
24
-
25
-
26
-
27
-
 28
28 -
 29
29 -
 30
30 -
 31
31 -
 32
32 -
 33
33 -
 34
34 -
 35
35 -
 36
36 -
 37
37 -
 38
38 -
 39
39 -
 40
40 -
 41
41 -
 42
42 -
 43
43 -
 44
44 -
 45
45 -
 46
46 -
 47
47 -
 48
48 -
49
-
50
-
51
-
52
-
53
-
54
-
55
-
56
-
57
-
58
-
59
-
60
-
61
-
62
-
63
-
64
-
65
-
66
-
67
-
68
-
69
-
70
-
71
-
72
-
73
-
74
-
75
-
76
-
77
-
78
-
79
-
80
-
81
-
82
-
83
-
84
-
85
-
86
-
87
-
88
-
89
-
90
-
91
-
92
-
93
-
94
-
95
-
96
-
97
-
98
-
99
-
100
-
101
-
102
-
103
-
104
-
105
-
106
-
107
-
108
-
109
-
110
-
111
-
112
-
113
-
114
-
115
-
116
-
117
-
118
-
119
-
120
-
121
-
122
-
123
-
124
-
125
-
126
-
127
-
128
-
129
-
130
-
131
-
132
-
133
-
134
-
135
-
136
-
137
 |
 |

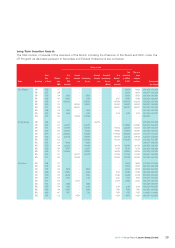
2010/11 Annual Report Lenovo Group Limited 41
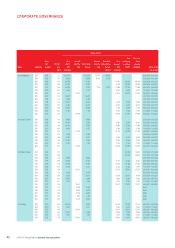
Number of units
Name Award type
Fiscal
Year
of Award
Effective
price
As at
April 1,
2010
Awarded
during the
year
Vested during
the year
Exercised
during the
year
Cancelled/
lapsed during
the year
As at
March 31,
2011
Total
outstanding
as at March
31, 2011
Max no. of
shares
subject to
conditions Vesting period
(HK$) (unvested) (Note 3) (unvested) (mm.dd.yyyy)
Professor Woo Chia-Wei SAR 05/06 3.15 – – – – – – 564,000 564,000 05.01.2006-05.01.2008
SAR 06/07 2.99 – – – – – – 390,000 390,000 06.01.2007-06.01.2009
SAR 07/08 3.94 99,000 –99,000 – – – – – 06.01.2008 – 06.01.2010
SAR 08/09 5.88 130,654 –65,327 – – 65,327 65,327 65,327 06.01.2009 – 06.01.2011
SAR 09/10 3.88 263,796 –87,932 – – 175,864 175,864 175,864 08.07.2010 – 08.07.2012
SAR 09/10 4.47 38,163 –12,721 – – 25,442 25,442 25,442 11.30.2010 – 11.30.2012
SAR 10/11 4.59 –237,001 – – – 237,001 237,001 237,001 08.20.2011 – 08.20.2013
RSU 07/08 3.94 33,000 –33,000 – – – – – 06.01.2008 – 06.01.2010
RSU 08/09 5.88 52,260 –26,130 – – 26,130 26,130 26,130 06.01.2009 – 06.01.2011
RSU 09/10 3.88 119,907 –39,969 – – 79,938 79,938 79,938 08.07.2010 – 08.07.2012
RSU 09/10 4.47 17,347 –5,782 – – 11,565 11,565 11,565 11.30.2010 – 11.30.2012
RSU 10/11 4.59 –118,501 – – – 118,501 118,501 118,501 08.20.2011 – 08.20.2013
RSU 10/11 4.74 –32,700 32,700 – – – – – Note 1
RSU 10/11 4.59 –33,857 33,857 –––––Note 1
RSU 10/11 5.66 –27,385 27,385 – – – – – Note 1
RSU 10/11 5.47 –3,576 3,576 – – – – – Note 1
RSU 10/11 4.88 –31,762 31,762 – – – – – Note 1
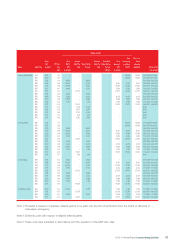
Mr. Ting Lee Sen SAR 05/06 3.15 – – – – – – 564,000 564,000 05.01.2006-05.01.2008
SAR 06/07 2.99 – – – – – – 390,000 390,000 06.01.2007-06.01.2009
SAR 07/08 3.94 99,000 –99,000 – – – – – 06.01.2008 – 06.01.2010
SAR 08/09 5.88 130,654 –65,327 – – 65,327 65,327 65,327 06.01.2009 – 06.01.2011
SAR 09/10 3.88 263,796 –87,932 – – 175,864 175,864 175,864 08.07.2010 – 08.07.2012
SAR 09/10 4.47 38,163 –12,721 – – 25,442 25,442 25,442 11.30.2010 – 11.30.2012
SAR 10/11 4.59 –237,001 – – – 237,001 237,001 237,001 08.20.2011 – 08.20.2013
RSU 07/08 3.94 33,000 –33,000 – – – – – 06.01.2008 – 06.01.2010
RSU 08/09 5.88 52,260 –26,130 – – 26,130 26,130 26,130 06.01.2009 – 06.01.2011
RSU 09/10 3.88 119,907 –39,969 – – 79,938 79,938 79,938 08.07.2010 – 08.07.2012
RSU 09/10 4.47 17,347 –5,782 – – 11,565 11,565 11,565 11.30.2010 – 11.30.2012
RSU 10/11 4.59 –118,501 – – – 118,501 118,501 118,501 11.30.2011 – 11.30.2013
RSU 10/11 5.47 –1,908 1,293 – – – – – Note 1
Dr. Tian Suning SAR 07/08 5.14 50,650 –50,650 – – – – – 09.01.2008 – 09.01.2010
SAR 08/09 5.88 130,654 –65,327 – – 65,327 65,327 65,327 06.01.2009 – 06.01.2011
SAR 09/10 3.88 263,796 –87,932 – – 175,864 175,864 175,864 08.07.2010 – 08.07.2012
SAR 09/10 4.47 38,163 –12,721 – – 25,442 25,442 25,442 11.30.2010 – 11.30.2012
SAR 10/11 4.59 –237,001 – – – 237,001 237,001 237,001 08.20.2011 – 08.20.2013
RSU 07/08 5.14 16,884 –16,884 – – – – – 09.01.2008 – 09.01.2010
RSU 08/09 5.88 52,260 –26,130 – – 26,130 26,130 26,130 06.01.2009 – 06.01.2011
RSU 09/10 3.88 119,907 –39,969 – – 79,938 79,938 79,938 08.07.2010 – 08.07.2012
RSU 09/10 4.47 17,347 –5,782 – – 11,565 11,565 11,565 11.30.2010 – 11.30.2012
RSU 10/11 4.59 –118,501 – – – 118,501 118,501 118,501 08.20.2011 – 08.20.2013
Mr. Nicholas C. Allen SAR 09/10 4.47 107,343 –35,781 – – 71,562 71,562 71,562 11.30.2010 – 11.30.2012
SAR 10/11 4.59 –237,001 – – – 237,001 237,001 237,001 08.20.2011 – 08.20.2013
RSU 09/10 4.47 48,792 –16,264 – – 32,528 32,528 32,528 11.30.2010 – 11.30.2012
RSU 10/11 4.59 –118,501 – – – 118,501 118,501 118,501 08.20.2011 – 08.20.2013
Note 1: Proceeds in respect of quarterly deferral grants to be paid only at point of termination from the board of directors or
unforeseen emergency.
Note 2: Dividends paid with respect to eligible deferral grants.
Note 3: These units were cancelled in accordance with the operation of the SAR plan rules.