Lenovo 2011 Annual Report Download - page 135
Download and view the complete annual report
Please find page 135 of the 2011 Lenovo annual report below. You can navigate through the pages in the report by either clicking on the pages listed below, or by using the keyword search tool below to find specific information within the annual report.-
 1
1 -
2
-
3
-
4
-
5
-
6
-
7
-
8
-
9
-
10
-
11
-
12
-
13
-
14
-
15
-
16
-
17
-
18
-
19
-
20
-
21
-
22
-
23
-
24
-
25
-
26
-
27
-
28
-
29
-
30
-
31
-
32
-
33
-
34
-
35
-
36
-
37
-
38
-
39
-
40
-
41
-
42
-
43
-
44
-
45
-
46
-
47
-
48
-
49
-
50
-
51
-
52
-
53
-
54
-
55
-
56
-
57
-
58
-
59
-
60
-
61
-
62
-
63
-
64
-
65
-
66
-
67
-
68
-
69
-
70
-
71
-
72
-
73
-
74
-
75
-
76
-
77
-
78
-
79
-
80
-
81
-
82
-
83
-
84
-
85
-
86
-
87
-
88
-
89
-
90
-
91
-
92
-
93
-
94
-
95
-
96
-
97
-
98
-
99
-
100
-
101
-
102
-
103
-
104
-
105
-
106
-
107
-
108
-
109
-
110
-
111
-
112
-
113
-
114
-
115
-
116
-
117
-
118
-
119
-
120
-
121
-
122
-
123
-
124
-
 125
125 -
 126
126 -
 127
127 -
 128
128 -
 129
129 -
 130
130 -
 131
131 -
 132
132 -
 133
133 -
 134
134 -
 135
135 -
 136
136 -
 137
137
 |
 |

2010/11 Annual Report Lenovo Group Limited
138
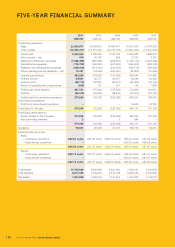
FIVE-YEAR FINANCIAL SUMMARY
2011 2010 2009 2008 2007
US$’000 US$’000 US$’000 US$’000 US$’000
Continuing operations
Sales 21,594,371 16,604,815 14,900,931 16,351,503 13,978,309
Cost of sales (19,230,417) (14,815,221) (13,103,735) (13,901,523) (12,091,433)
Gross profit 2,363,954 1,789,594 1,797,196 2,449,980 1,886,876
Other income – net 419 83,126 929 17,261 8,187
Selling and distribution expenses (1,038,455) (839,388) (938,451) (1,103,713) (1,033,296)
Administrative expenses (719,708) (566,245) (627,903) (595,902) (488,150)
Research and development expenses (303,413) (214,343) (220,010) (229,759) (196,225)
Other operating income (expense) – net 79,427 (34,058) (203,561) (38,823) (15,906)
Operating profit/(loss) 382,224 218,686 (191,800) 499,044 161,486
Finance income 24,927 20,377 59,977 52,048 26,329
Finance costs (49,175) (62,881) (56,473) (38,366) (35,133)
Share of (losses)/profits of associates (225) 121 351 124 1,869
Profit/(loss) before taxation 357,751 176,303 (187,945) 512,850 154,551
Taxation (84,515) (46,935) (38,444) (47,613) (26,197)
Profit/(loss) from continuing operations 273,236 129,368 (226,389) 465,237 128,354
Discontinued operations
Profit from discontinued operations –– – 19,920 32,784
Profit/(loss) for the year 273,236 129,368 (226,389) 485,157 161,138
Profit/(loss) attributable to:
Equity holders of the Company 273,234 129,368 (226,392) 484,263 161,138
Non-controlling interests 2– 3 894 –
273,236 129,368 (226,389) 485,157 161,138
Dividends 96,601 68,728 35,575 186,753 59,331
Earnings/(loss) per share
Basic
– Continuing operations US2.84 cents US1.42 cents (US2.56 cents) US5.29 cents US1.49 cents
– Discontinued operations –– – US0.22 cents US0.38 cents
US2.84 cents US1.42 cents (US2.56 cents) US5.51 cents US1.87 cents
Diluted
– Continuing operations US2.73 cents US1.33 cents (US2.56 cents) US4.86 cents US1.47 cents
– Discontinued operations –– – US0.20 cents US0.37 cents
US2.73 cents US1.33 cents (US2.56 cents) US5.06 cents US1.84 cents
Total assets 10,705,939 8,955,928 6,621,663 7,539,321 5,450,838
Total liabilities 8,871,039 7,349,910 5,310,748 5,926,058 4,316,562
Net assets 1,834,900 1,606,018 1,310,915 1,613,263 1,134,276