Lenovo 2011 Annual Report Download - page 121
Download and view the complete annual report
Please find page 121 of the 2011 Lenovo annual report below. You can navigate through the pages in the report by either clicking on the pages listed below, or by using the keyword search tool below to find specific information within the annual report.-
 1
1 -
2
-
3
-
4
-
5
-
6
-
7
-
8
-
9
-
10
-
11
-
12
-
13
-
14
-
15
-
16
-
17
-
18
-
19
-
20
-
21
-
22
-
23
-
24
-
25
-
26
-
27
-
28
-
29
-
30
-
31
-
32
-
33
-
34
-
35
-
36
-
37
-
38
-
39
-
40
-
41
-
42
-
43
-
44
-
45
-
46
-
47
-
48
-
49
-
50
-
51
-
52
-
53
-
54
-
55
-
56
-
57
-
58
-
59
-
60
-
61
-
62
-
63
-
64
-
65
-
66
-
67
-
68
-
69
-
70
-
71
-
72
-
73
-
74
-
75
-
76
-
77
-
78
-
79
-
80
-
81
-
82
-
83
-
84
-
85
-
86
-
87
-
88
-
89
-
90
-
91
-
92
-
93
-
94
-
95
-
96
-
97
-
98
-
99
-
100
-
101
-
102
-
103
-
104
-
105
-
106
-
107
-
108
-
109
-
110
-
 111
111 -
 112
112 -
 113
113 -
 114
114 -
 115
115 -
 116
116 -
 117
117 -
 118
118 -
 119
119 -
 120
120 -
 121
121 -
 122
122 -
 123
123 -
 124
124 -
 125
125 -
 126
126 -
 127
127 -
 128
128 -
 129
129 -
 130
130 -
 131
131 -
132
-
133
-
134
-
135
-
136
-
137
 |
 |

2010/11 Annual Report Lenovo Group Limited
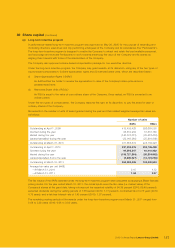
124
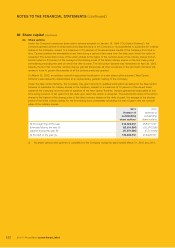
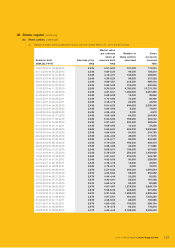
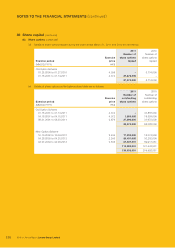
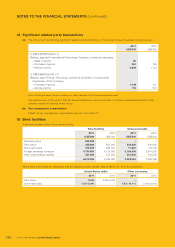
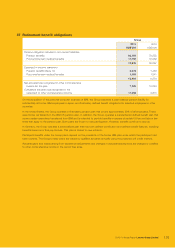
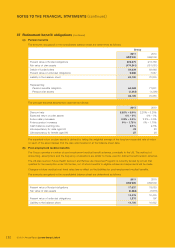
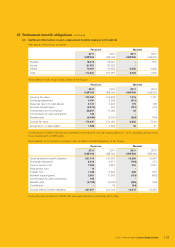
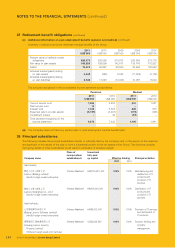
NOTES TO THE FINANCIAL STATEMENTS (continued)
30 Share capital (continued)
(b) Share options (continued)
(ii) Details of share options exercised during the year ended March 31, 2011 are as follows: (continued)
Exercise date Exercise price
Market value
per ordinary
share at
exercise date
Number of
share options
exercised
Gross
proceeds
received
(MM.DD.YYYY) HK$ HK$ HK$
09.06.2010 to 09.22.2010 4.072 4.70-4.81 1,930,000 7,858,960
11.22.2010 to 11.23.2010 4.072 5.35-5.54 2,084,000 8,486,048
12.06.2010 to 12.31.2010 4.072 4.98-5.61 2,608,000 10,619,776
02.21.2011 to 02.21.2011 4.072 4.92-4.92 200,000 814,400
03.23.2011 to 03.29.2011 4.072 4.26-4.48 8,134,000 33,121,648
04.13.2010 to 04.26.2010 4.312 5.51-6.20 2,039,000 8,792,168
05.04.2010 to 05.24.2010 4.312 5.02-5.84 174,000 750,288
06.01.2010 to 06.01.2010 4.312 4.66-4.66 24,000 103,488
07.27.2010 to 07.28.2010 4.312 4.88-4.96 82,000 353,584
08.03.2010 to 08.11.2010 4.312 4.66-5.24 228,000 983,136
09.13.2010 to 09.27.2010 4.312 4.66-4.88 296,710 1,279,414
10.25.2010 to 10.27.2010 4.312 5.09-5.33 1,090,000 4,700,080
11.01.2010 to 11.22.2010 4.312 5.18-5.54 5,193,290 22,393,466
12.06.2010 to 12.21.2010 4.312 4.95-5.61 5,084,000 21,922,208
01.04.2011 to 01.11.2011 4.312 4.68-5.08 6,002,000 25,880,624
52,614,500 195,145,709
US$25,116,000
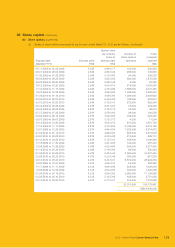
Details of share options exercised during the year ended March 31, 2010 are as follows:
Exercise date Exercise price
Market value
per ordinary
share at
exercise date
Number of
share options
exercised
Gross
proceeds
received
(MM.DD.YYYY) HK$ HK$ HK$
05.11.2009 to 05.25.2009 2.245 2.86-3.17 196,000 440,020
06.01.2009 to 06.05.2009 2.245 3.03-3.29 226,000 507,370
07.20.2009 to 07.28.2009 2.245 3.15-3.60 106,000 237,970
08.04.2009 to 08.04.2009 2.245 3.93-3.93 112,000 251,440
09.07.2009 to 09.07.2009 2.245 3.72-3.72 20,000 44,900
10.12.2009 to 10.20.2009 2.245 4.03-4.70 388,000 871,060
11.10.2009 to 11.17.2009 2.245 4.15-4.69 1,622,000 3,641,390
12.07.2009 to 12.28.2009 2.245 4.26-4.84 698,000 1,567,010
01.04.2010 to 01.14.2010 2.245 4.99-5.90 480,000 1,077,600
02.02.2010 to 02.03.2010 2.245 5.40-5.68 82,000 184,090
03.10.2010 to 03.23.2010 2.245 5.12-5.41 478,000 1,073,110
05.11.2009 to 05.26.2009 2.435 2.86-3.03 88,000 214,280
06.02.2009 to 06.05.2009 2.435 3.03-3.12 78,000 189,930
07.21.2009 to 07.28.2009 2.435 3.36-3.60 60,000 146,100
08.04.2009 to 08.04.2009 2.435 3.93-3.93 104,000 253,240
09.07.2009 to 09.07.2009 2.435 3.72-3.72 12,000 29,220
10.13.2009 to 10.20.2009 2.435 4.20-4.70 141,500 344,553
11.10.2009 to 11.17.2009 2.435 4.15-4.69 98,000 238,630
12.07.2009 to 12.29.2009 2.435 4.26-4.85 418,000 1,017,830
01.14.2010 to 01.27.2010 2.435 5.08-5.90 346,000 842,510
02.03.2010 to 02.03.2010 2.435 5.68-5.68 14,000 34,090
03.10.2010 to 03.23.2010 2.435 5.12-5.41 248,000 603,880