Lenovo 2011 Annual Report Download - page 96
Download and view the complete annual report
Please find page 96 of the 2011 Lenovo annual report below. You can navigate through the pages in the report by either clicking on the pages listed below, or by using the keyword search tool below to find specific information within the annual report.-
 1
1 -
2
-
3
-
4
-
5
-
6
-
7
-
8
-
9
-
10
-
11
-
12
-
13
-
14
-
15
-
16
-
17
-
18
-
19
-
20
-
21
-
22
-
23
-
24
-
25
-
26
-
27
-
28
-
29
-
30
-
31
-
32
-
33
-
34
-
35
-
36
-
37
-
38
-
39
-
40
-
41
-
42
-
43
-
44
-
45
-
46
-
47
-
48
-
49
-
50
-
51
-
52
-
53
-
54
-
55
-
56
-
57
-
58
-
59
-
60
-
61
-
62
-
63
-
64
-
65
-
66
-
67
-
68
-
69
-
70
-
71
-
72
-
73
-
74
-
75
-
76
-
77
-
78
-
79
-
80
-
81
-
82
-
83
-
84
-
85
-
 86
86 -
 87
87 -
 88
88 -
 89
89 -
 90
90 -
 91
91 -
 92
92 -
 93
93 -
 94
94 -
 95
95 -
 96
96 -
 97
97 -
 98
98 -
 99
99 -
 100
100 -
 101
101 -
 102
102 -
 103
103 -
 104
104 -
 105
105 -
 106
106 -
107
-
108
-
109
-
110
-
111
-
112
-
113
-
114
-
115
-
116
-
117
-
118
-
119
-
120
-
121
-
122
-
123
-
124
-
125
-
126
-
127
-
128
-
129
-
130
-
131
-
132
-
133
-
134
-
135
-
136
-
137
 |
 |

2010/11 Annual Report Lenovo Group Limited 99
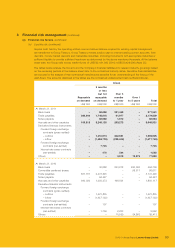
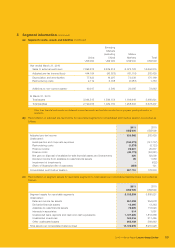
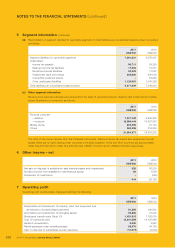
5 Segment information (continued)
(a) Segment results, assets and liabilities (continued)
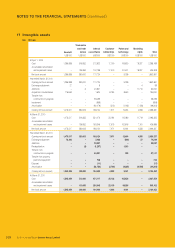
China
Emerging
Markets
(excluding
China)
Mature
Markets Total
US$’000 US$’000 US$’000 US$’000
Year ended March 31, 2010
Sales to external customers 7,892,275 2,639,812 6,072,728 16,604,815
Adjusted pre-tax income/(loss) 444,164 (96,625) (65,119) 282,420
Depreciation and amortization 77,833 19,297 73,039 170,169
Restructuring costs 2,112 5,708 (6,087) 1,733
Additions to non-current assets* 49,017 3,540 20,085 72,642
At March 31, 2010
Total assets 3,094,515 1,586,158 1,199,948 5,880,621
Total liabilities 2,190,074 1,929,730 1,258,603 5,378,407
* Other than financial instruments and deferred income tax assets; and exclude construction-in-progress pending allocation to
segments.
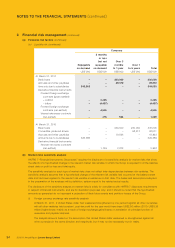
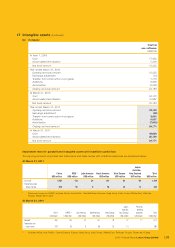
(b) Reconciliation of adjusted pre-tax income for reportable segments to consolidated profit before taxation is provided as
follows:
2011 2010
US$’000 US$’000
Adjusted pre-tax income 520,562 282,420
Unallocated:
Headquarters and corporate expenses (134,879) (141,737)
Restructuring costs (3,878) (5,123)
Finance income 24,927 20,377
Finance costs (49,175) (62,881)
Net gain on disposal of available-for-sale financial assets and investments 326 82,090
Dividend income from available-for-sale financial assets 93 1,558
Impairment of investments –(522)
Share of (losses)/profits of associates (225) 121
Consolidated profit before taxation 357,751 176,303
(c) Reconciliation of segment assets for reportable segments to total assets per consolidated balance sheet is provided as
follows:
2011 2010
US$’000 US$’000
Segment assets for reportable segments 8,185,399 5,880,621
Unallocated:
Deferred income tax assets 251,098 254,978
Derivative financial assets 13,295 13,283
Available-for-sale financial assets 78,689 112,520
Interests in associates 914 1,061
Unallocated bank deposits and cash and cash equivalents 1,727,569 1,813,368
Unallocated inventories 180,516 311,455
Other unallocated assets 268,459 568,642
Total assets per consolidated balance sheet 10,705,939 8,955,928